Food distribution giant Performance Food Group (NYSE: PFGC) met Wall Streets revenue expectations in Q4 CY2025, with sales up 5.2% year on year to $16.44 billion. On the other hand, next quarter’s revenue guidance of $16.15 billion was less impressive, coming in 0.5% below analysts’ estimates. Its non-GAAP profit of $0.98 per share was 10% below analysts’ consensus estimates.
Is now the time to buy Performance Food Group? Find out by accessing our full research report, it’s free.
Performance Food Group (PFGC) Q4 CY2025 Highlights:
- Revenue: $16.44 billion vs analyst estimates of $16.52 billion (5.2% year-on-year growth, in line)
- Adjusted EPS: $0.98 vs analyst expectations of $1.09 (10% miss)
- Adjusted EBITDA: $451.2 million vs analyst estimates of $464.2 million (2.7% margin, 2.8% miss)
- The company reconfirmed its revenue guidance for the full year of $67.75 billion at the midpoint
- EBITDA guidance for the full year is $1.93 billion at the midpoint, below analyst estimates of $1.98 billion
- Operating Margin: 1.2%, in line with the same quarter last year
- Free Cash Flow Margin: 3%, up from 1.4% in the same quarter last year
- Sales Volumes rose 3.4% year on year (9.8% in the same quarter last year)
- Market Capitalization: $15.22 billion
Company Overview
With a massive network spanning 155 distribution centers and delivering over 250,000 different food products, Performance Food Group (NYSE: PFGC) distributes food and food-related products to over 300,000 restaurants, convenience stores, theaters, and institutions across North America.
Revenue Growth
Reviewing a company’s long-term sales performance reveals insights into its quality. Any business can experience short-term success, but top-performing ones enjoy sustained growth for years. Over the last five years, Performance Food Group grew its sales at a 19.8% compounded annual growth rate. Although this growth is acceptable on an absolute basis, it fell slightly short of our standards for the consumer discretionary sector, which enjoys a number of secular tailwinds.
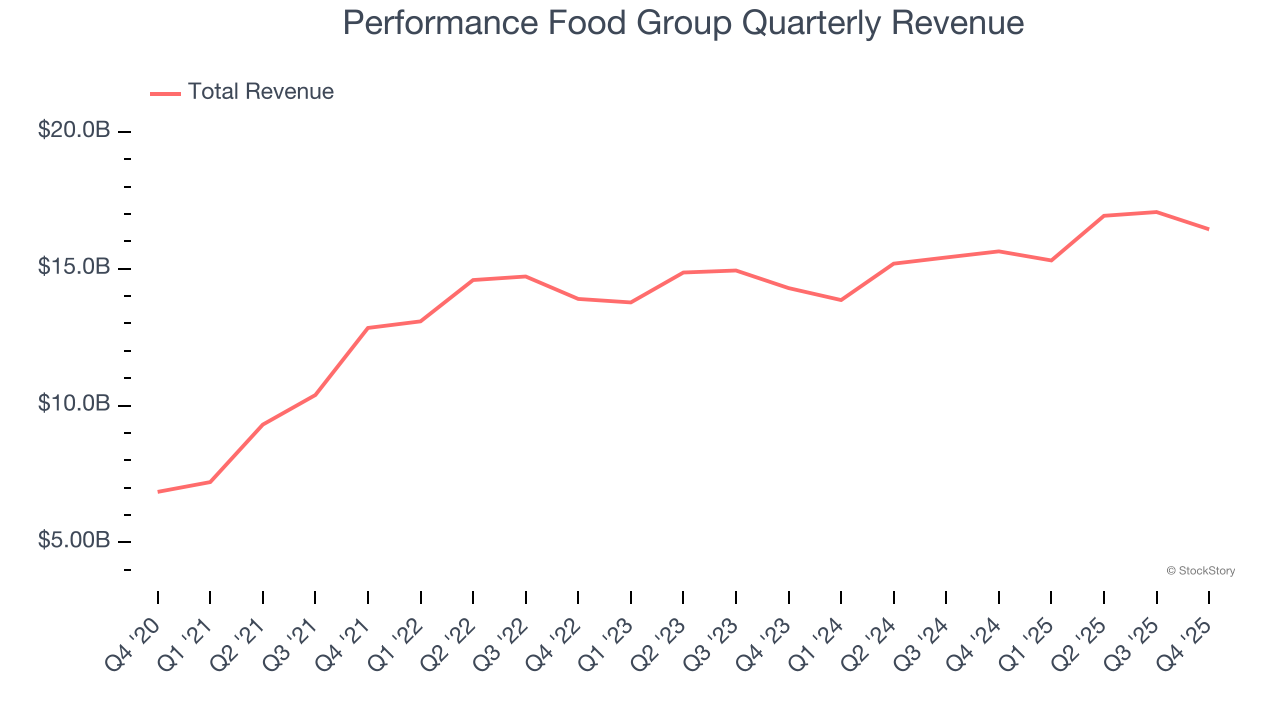
We at StockStory place the most emphasis on long-term growth, but within consumer discretionary, a stretched historical view may miss a company riding a successful new product or trend. Performance Food Group’s recent performance shows its demand has slowed as its annualized revenue growth of 6.6% over the last two years was below its five-year trend. 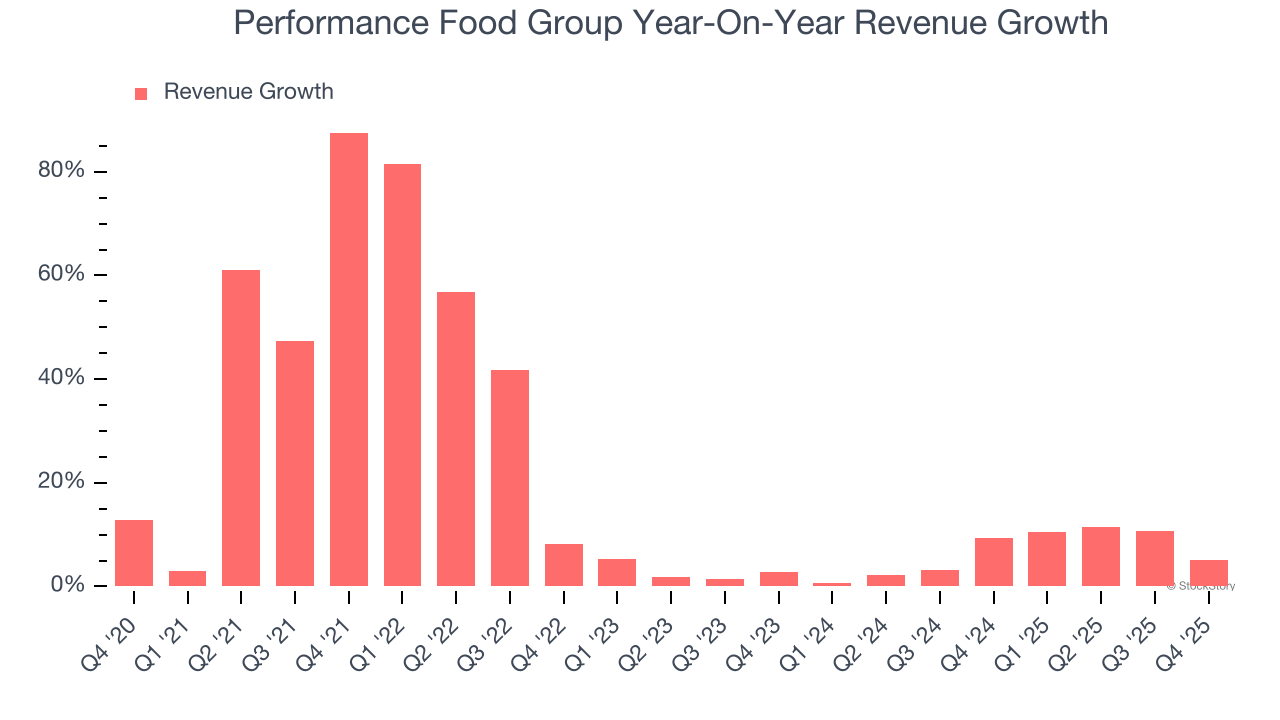
We can dig further into the company’s revenue dynamics by analyzing its number of units sold. Over the last two years, Performance Food Group’s units sold averaged 6% year-on-year growth. Because this number is in line with its revenue growth, we can see the company kept its prices fairly consistent. 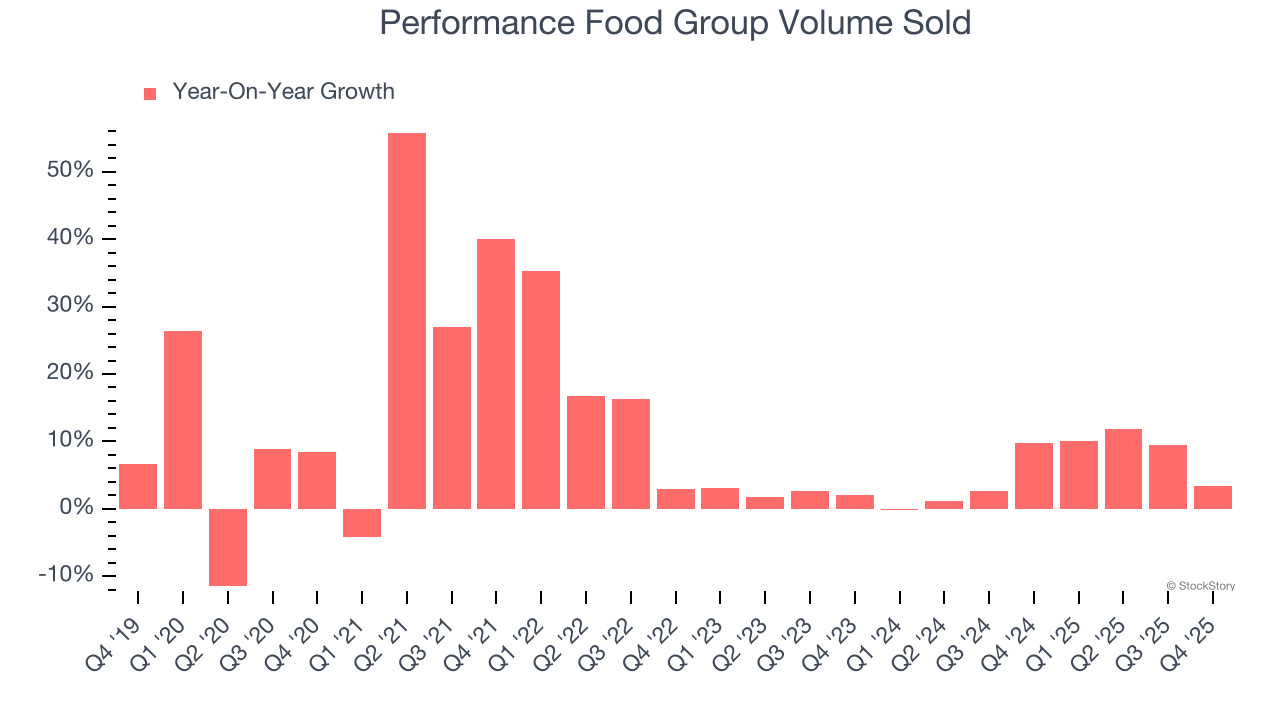
This quarter, Performance Food Group grew its revenue by 5.2% year on year, and its $16.44 billion of revenue was in line with Wall Street’s estimates. Company management is currently guiding for a 5.5% year-on-year increase in sales next quarter.
Looking further ahead, sell-side analysts expect revenue to grow 5.6% over the next 12 months, similar to its two-year rate. This projection is underwhelming and indicates its newer products and services will not accelerate its top-line performance yet.
Microsoft, Alphabet, Coca-Cola, Monster Beverage—all began as under-the-radar growth stories riding a massive trend. We’ve identified the next one: a profitable AI semiconductor play Wall Street is still overlooking. Go here for access to our full report.
Operating Margin
Operating margin is a key measure of profitability. Think of it as net income - the bottom line - excluding the impact of taxes and interest on debt, which are less connected to business fundamentals.
Performance Food Group’s operating margin might fluctuated slightly over the last 12 months but has generally stayed the same, averaging 1.3% over the last two years. This profitability was inadequate for a consumer discretionary business and caused by its suboptimal cost structure.
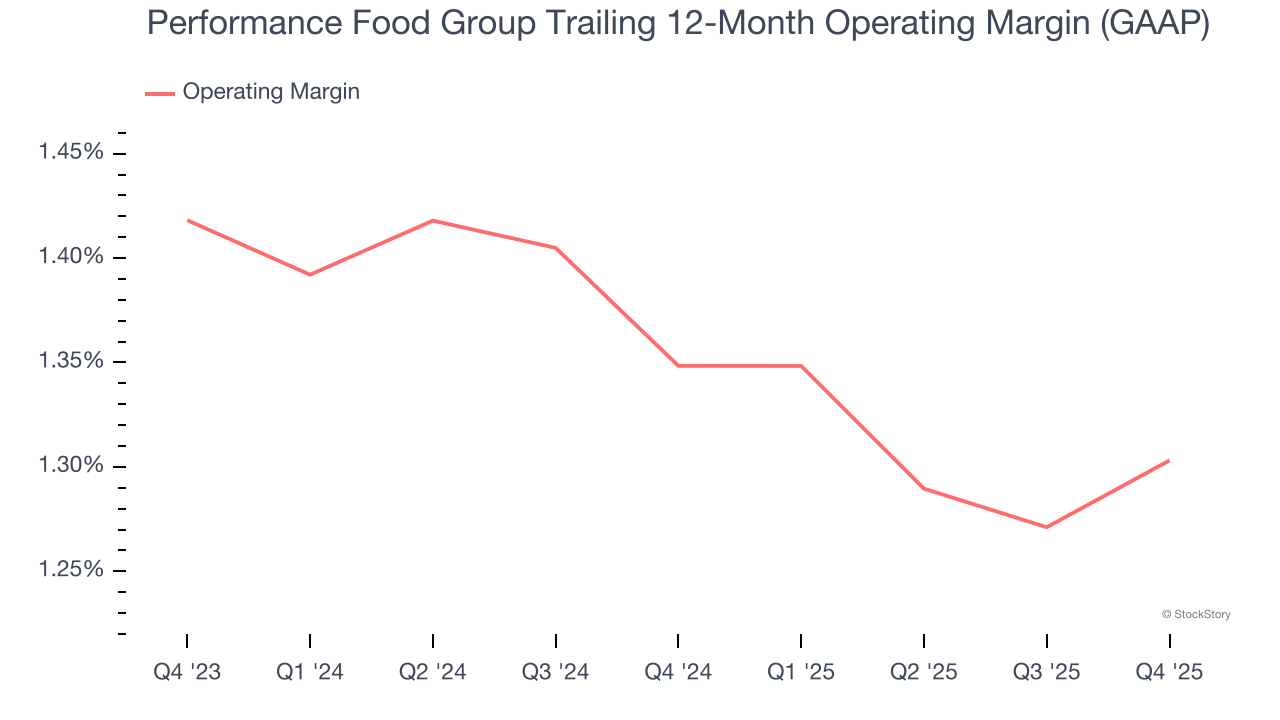
This quarter, Performance Food Group generated an operating margin profit margin of 1.2%, in line with the same quarter last year. This indicates the company’s overall cost structure has been relatively stable.
Earnings Per Share
We track the long-term change in earnings per share (EPS) for the same reason as long-term revenue growth. Compared to revenue, however, EPS highlights whether a company’s growth is profitable.
Performance Food Group’s EPS grew at an astounding 69.7% compounded annual growth rate over the last five years, higher than its 19.8% annualized revenue growth. However, we take this with a grain of salt because its operating margin didn’t improve and it didn’t repurchase its shares, meaning the delta came from reduced interest expenses or taxes.
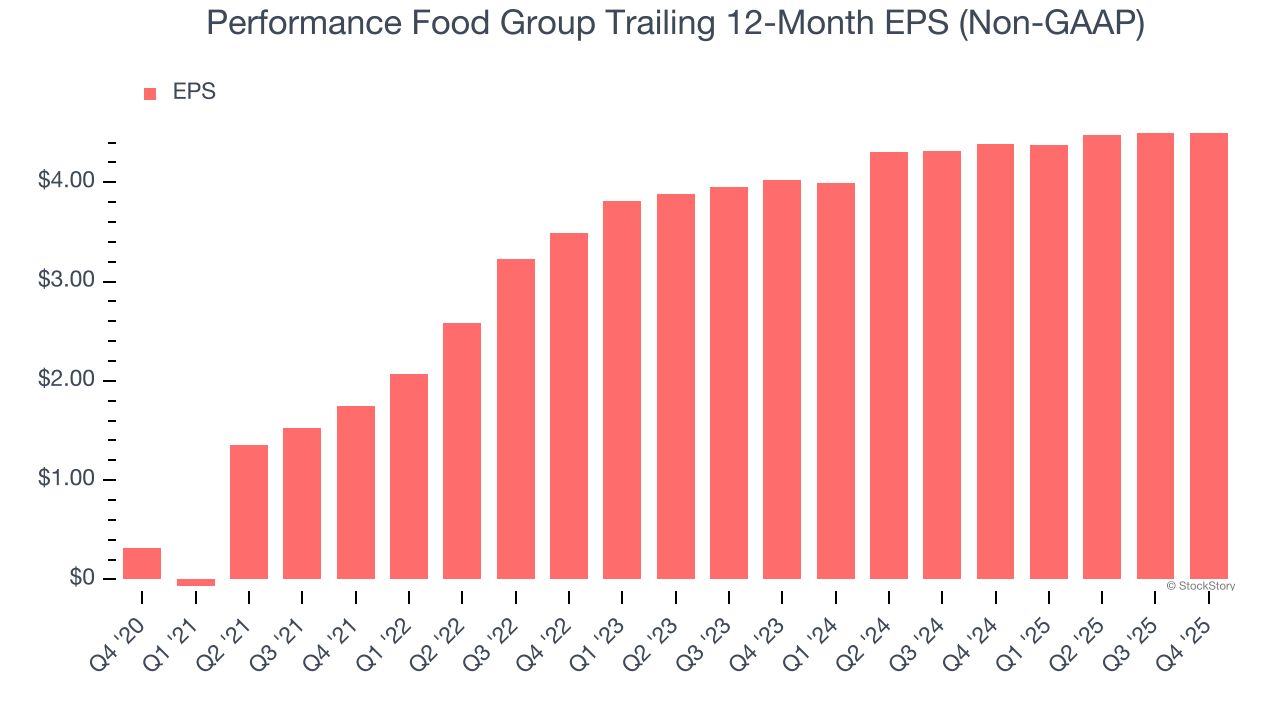
In Q4, Performance Food Group reported adjusted EPS of $0.98, in line with the same quarter last year. This print missed analysts’ estimates, but we care more about long-term adjusted EPS growth than short-term movements. Over the next 12 months, Wall Street expects Performance Food Group’s full-year EPS of $4.50 to grow 21.6%.
Key Takeaways from Performance Food Group’s Q4 Results
We struggled to find many positives in these results. Its EPS missed and its EBITDA guidance for next quarter fell short of Wall Street’s estimates. Overall, this quarter could have been better. The stock traded down 7.8% to $89.50 immediately after reporting.
Performance Food Group may have had a tough quarter, but does that actually create an opportunity to invest right now? When making that decision, it’s important to consider its valuation, business qualities, as well as what has happened in the latest quarter. We cover that in our actionable full research report which you can read here (it’s free).