

Self-storage and building solutions company Janus (NYSE: JBI) announced better-than-expected revenue in Q2 CY2025, but sales fell by 8.2% year on year to $228.1 million. The company expects the full year’s revenue to be around $875 million, close to analysts’ estimates. Its non-GAAP profit of $0.20 per share was 40.4% above analysts’ consensus estimates.
Is now the time to buy Janus? Find out by accessing our full research report, it’s free.
Janus (JBI) Q2 CY2025 Highlights:
- Revenue: $228.1 million vs analyst estimates of $216.2 million (8.2% year-on-year decline, 5.5% beat)
- Adjusted EPS: $0.20 vs analyst estimates of $0.14 (40.4% beat)
- Adjusted EBITDA: $49 million vs analyst estimates of $42.68 million (21.5% margin, 14.8% beat)
- The company reconfirmed its revenue guidance for the full year of $875 million at the midpoint
- EBITDA guidance for the full year is $185 million at the midpoint, above analyst estimates of $179.6 million
- Operating Margin: 15.8%, down from 20.8% in the same quarter last year
- Free Cash Flow Margin: 19.6%, up from 10.2% in the same quarter last year
- Market Capitalization: $1.21 billion
“Janus delivered strong results in the second quarter, and I am pleased with our performance in the first half of 2025 as our team continued to execute well in a dynamic operating environment,” said Ramey Jackson, Chief Executive Officer.
Company Overview
Standing out with its digital keyless entry into self-storage room technology, Janus (NYSE: JBI) is a provider of easily accessible self-storage solutions.
Revenue Growth
Reviewing a company’s long-term sales performance reveals insights into its quality. Any business can put up a good quarter or two, but the best consistently grow over the long haul. Luckily, Janus’s sales grew at an impressive 11% compounded annual growth rate over the last five years. Its growth beat the average industrials company and shows its offerings resonate with customers.
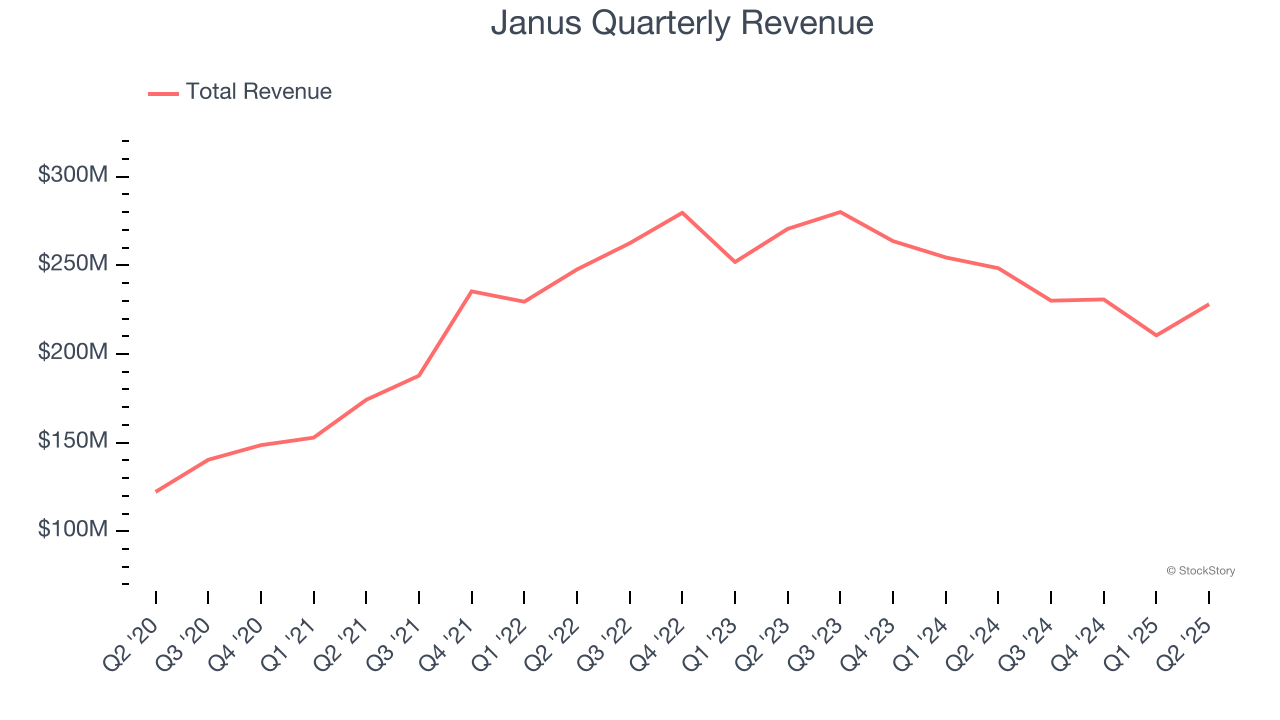
Long-term growth is the most important, but within industrials, a half-decade historical view may miss new industry trends or demand cycles. Janus’s recent performance marks a sharp pivot from its five-year trend as its revenue has shown annualized declines of 8.1% over the last two years. 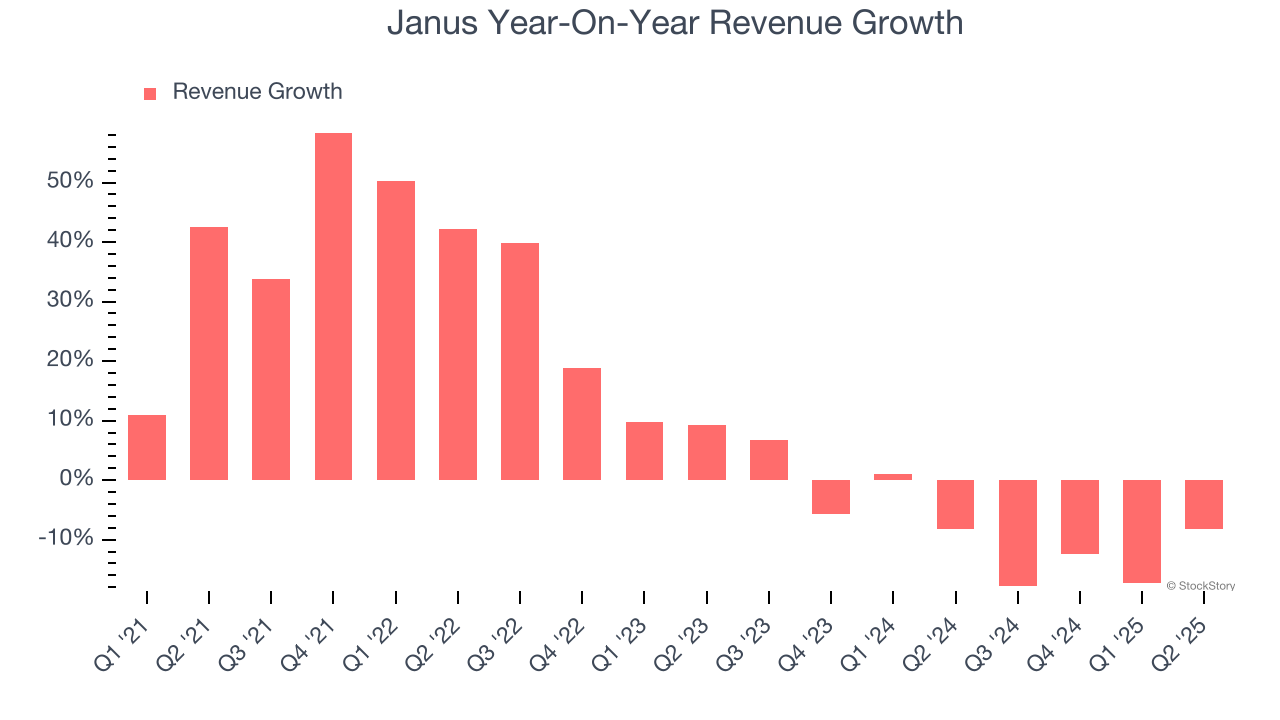
This quarter, Janus’s revenue fell by 8.2% year on year to $228.1 million but beat Wall Street’s estimates by 5.5%.
Looking ahead, sell-side analysts expect revenue to remain flat over the next 12 months. While this projection implies its newer products and services will catalyze better top-line performance, it is still below average for the sector.
Unless you’ve been living under a rock, it should be obvious by now that generative AI is going to have a huge impact on how large corporations do business. While Nvidia and AMD are trading close to all-time highs, we prefer a lesser-known (but still profitable) stock benefiting from the rise of AI. Click here to access our free report one of our favorites growth stories.
Operating Margin
Operating margin is a key measure of profitability. Think of it as net income - the bottom line - excluding the impact of taxes and interest on debt, which are less connected to business fundamentals.
Janus has been a well-oiled machine over the last five years. It demonstrated elite profitability for an industrials business, boasting an average operating margin of 17.3%. This result isn’t surprising as its high gross margin gives it a favorable starting point.
Looking at the trend in its profitability, Janus’s operating margin decreased by 3.3 percentage points over the last five years. This raises questions about the company’s expense base because its revenue growth should have given it leverage on its fixed costs, resulting in better economies of scale and profitability.
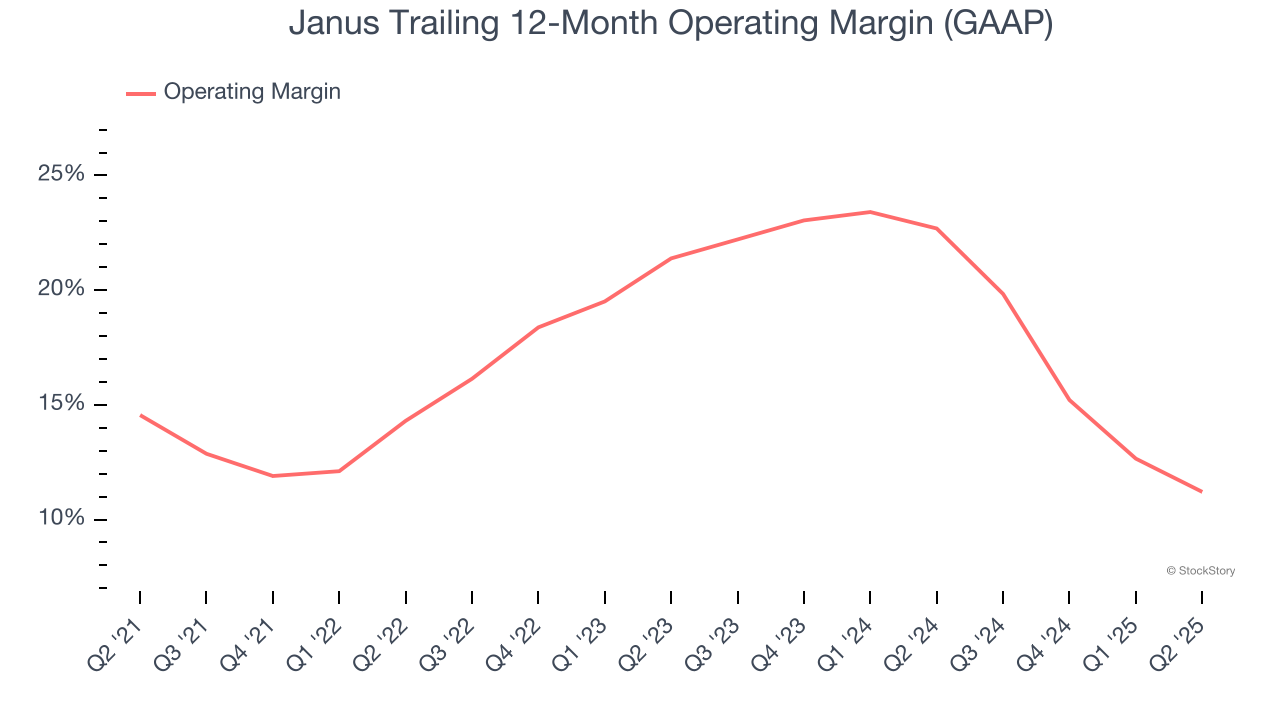
In Q2, Janus generated an operating margin profit margin of 15.8%, down 5 percentage points year on year. Since Janus’s operating margin decreased more than its gross margin, we can assume it was less efficient because expenses such as marketing, R&D, and administrative overhead increased.
Earnings Per Share
Revenue trends explain a company’s historical growth, but the change in earnings per share (EPS) points to the profitability of that growth – for example, a company could inflate its sales through excessive spending on advertising and promotions.
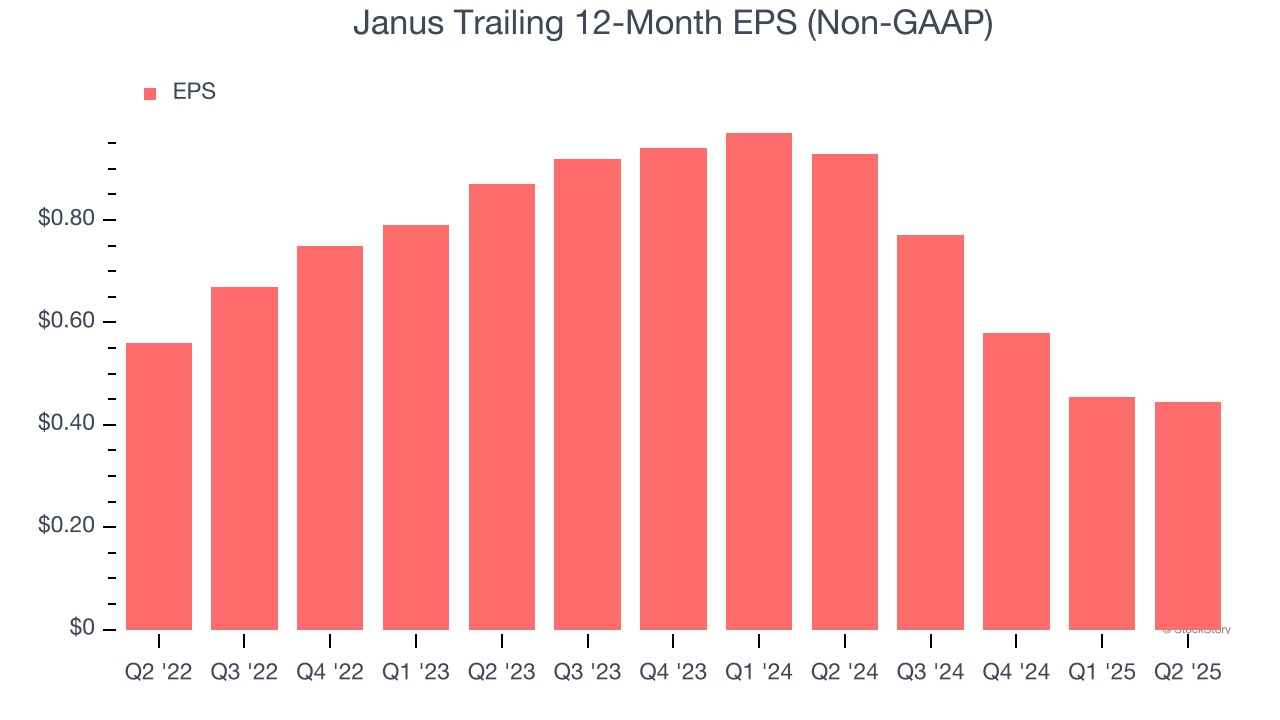
Sadly for Janus, its EPS declined by more than its revenue over the last two years, dropping 28.5%. This tells us the company struggled because its fixed cost base made it difficult to adjust to shrinking demand.
We can take a deeper look into Janus’s earnings to better understand the drivers of its performance. Janus’s operating margin has declined by 8 percentage points over the last two years. This was the most relevant factor (aside from the revenue impact) behind its lower earnings; interest expenses and taxes can also affect EPS but don’t tell us as much about a company’s fundamentals.
In Q2, Janus reported adjusted EPS at $0.20, in line with the same quarter last year. This print easily cleared analysts’ estimates, and shareholders should be content with the results. We also like to analyze expected EPS growth based on Wall Street analysts’ consensus projections, but there is insufficient data.
Key Takeaways from Janus’s Q2 Results
We were impressed by how significantly Janus blew past analysts’ EPS expectations this quarter. We were also excited its EBITDA outperformed Wall Street’s estimates by a wide margin. Zooming out, we think this quarter featured some important positives. The stock traded up 15.6% to $10.04 immediately following the results.
Janus put up rock-solid earnings, but one quarter doesn’t necessarily make the stock a buy. Let’s see if this is a good investment. The latest quarter does matter, but not nearly as much as longer-term fundamentals and valuation, when deciding if the stock is a buy. We cover that in our actionable full research report which you can read here, it’s free.


