

Professional tools and equipment manufacturer Snap-on (NYSE: SNA) missed Wall Street’s revenue expectations in Q1 CY2025, with sales falling 11% year on year to $1.14 billion. Its GAAP profit of $4.51 per share was 6.4% below analysts’ consensus estimates.
Is now the time to buy Snap-on? Find out by accessing our full research report, it’s free.
Snap-on (SNA) Q1 CY2025 Highlights:
- Revenue: $1.14 billion vs analyst estimates of $1.30 billion (11% year-on-year decline, 11.9% miss)
- EPS (GAAP): $4.51 vs analyst expectations of $4.82 (6.4% miss)
- Operating Margin: 27.5%, up from 26.5% in the same quarter last year
- Free Cash Flow Margin: 24.2%, up from 22.4% in the same quarter last year
- Organic Revenue fell 6.8% year on year, in line with the same quarter last year
- Market Capitalization: $17.4 billion
Company Overview
Founded in 1920, Snap-on (NYSE: SNA) is a global provider of tools, equipment, and diagnostics for various industries such as vehicle repair, aerospace, and the military.
Professional Tools and Equipment
Automation that increases efficiency and connected equipment that collects analyzable data have been trending, creating new demand. Some professional tools and equipment companies also provide software to accompany measurement or automated machinery, adding a stream of recurring revenues to their businesses. On the other hand, professional tools and equipment companies are at the whim of economic cycles. Consumer spending and interest rates, for example, can greatly impact the industrial production that drives demand for these companies’ offerings.
Sales Growth
A company’s long-term sales performance can indicate its overall quality. Any business can experience short-term success, but top-performing ones enjoy sustained growth for years. Unfortunately, Snap-on’s 4.4% annualized revenue growth over the last five years was sluggish. This was below our standard for the industrials sector and is a tough starting point for our analysis.
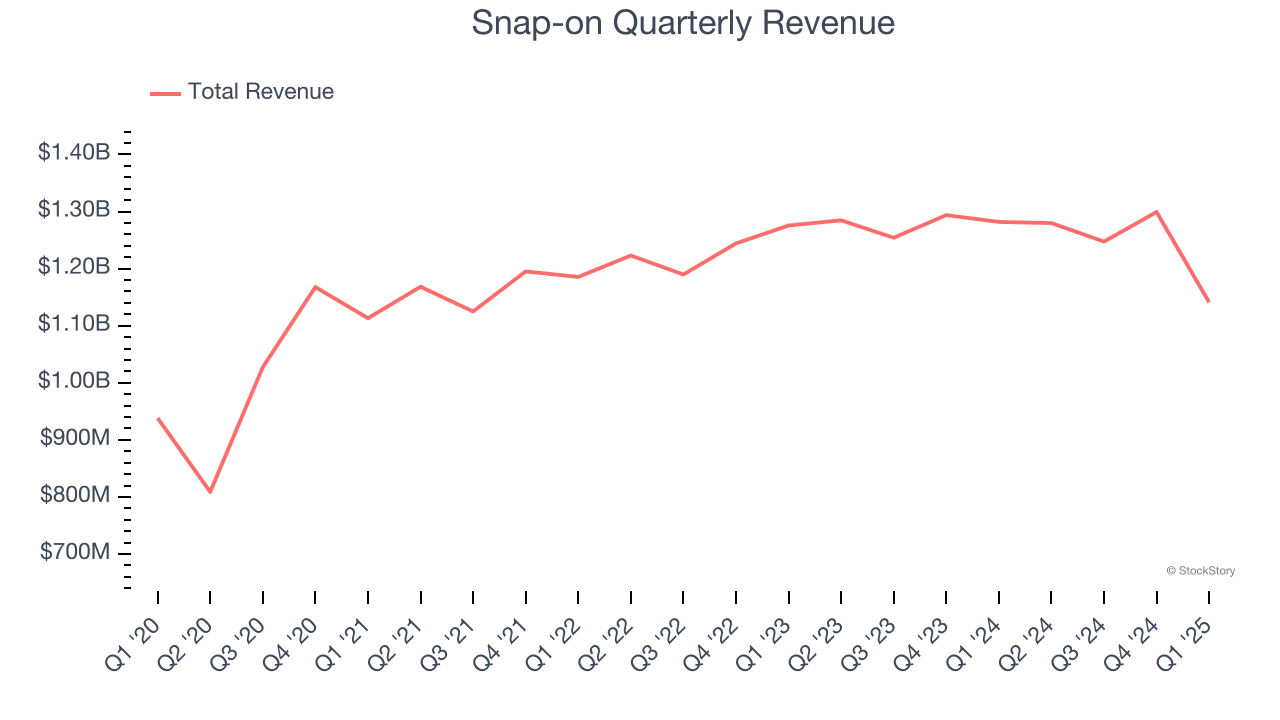
We at StockStory place the most emphasis on long-term growth, but within industrials, a half-decade historical view may miss cycles, industry trends, or a company capitalizing on catalysts such as a new contract win or a successful product line. Snap-on’s recent performance shows its demand has slowed as its revenue was flat over the last two years. We also note many other Professional Tools and Equipment businesses have faced declining sales because of cyclical headwinds. While Snap-on’s growth wasn’t the best, it did do better than its peers. 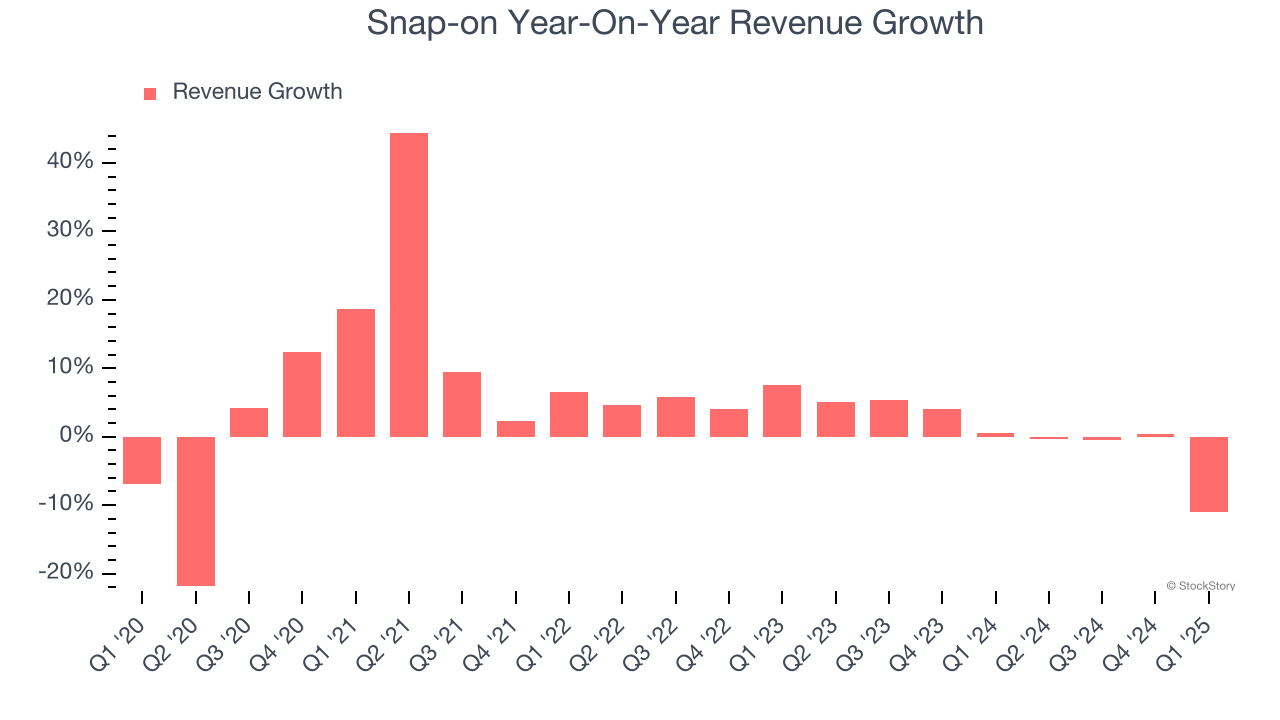
We can dig further into the company’s sales dynamics by analyzing its organic revenue, which strips out one-time events like acquisitions and currency fluctuations that don’t accurately reflect its fundamentals. Over the last two years, Snap-on’s organic revenue averaged 3.4% year-on-year declines. Because this number is lower than its normal revenue growth, we can see that some mixture of acquisitions and foreign exchange rates boosted its headline results. 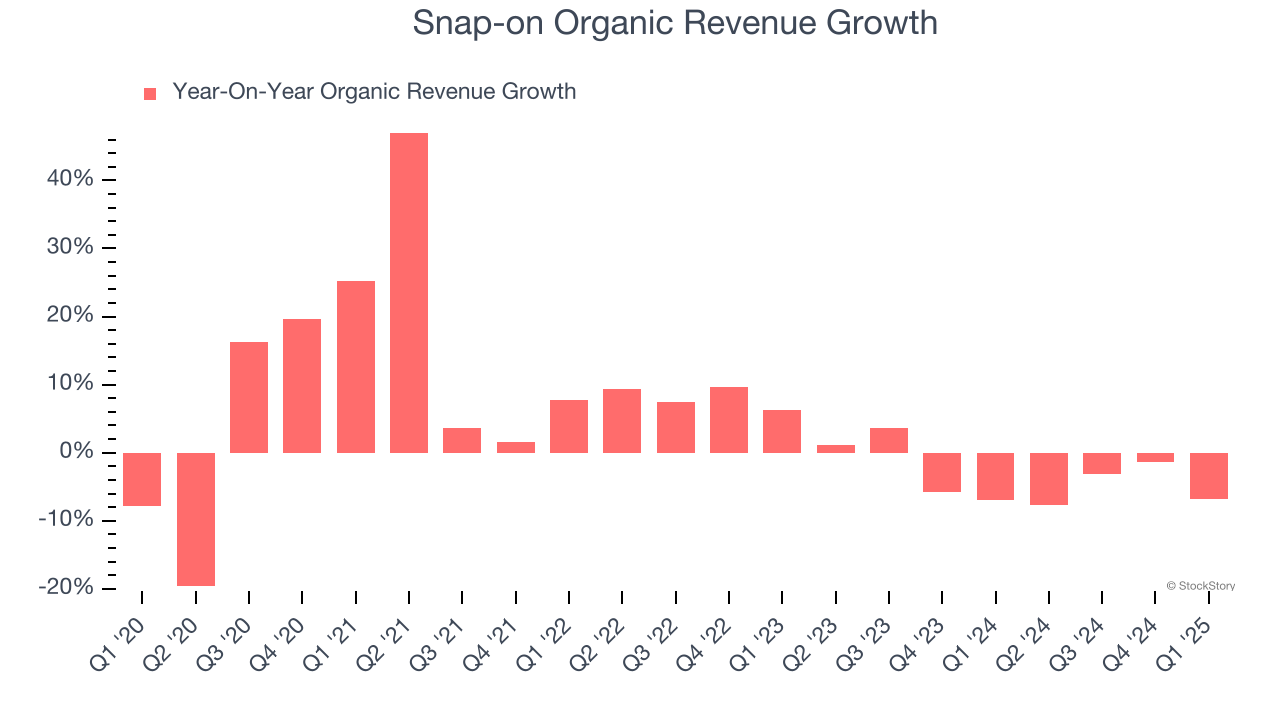
This quarter, Snap-on missed Wall Street’s estimates and reported a rather uninspiring 11% year-on-year revenue decline, generating $1.14 billion of revenue.
Looking ahead, sell-side analysts expect revenue to grow 6.7% over the next 12 months. Although this projection implies its newer products and services will spur better top-line performance, it is still below average for the sector.
Today’s young investors won’t have read the timeless lessons in Gorilla Game: Picking Winners In High Technology because it was written more than 20 years ago when Microsoft and Apple were first establishing their supremacy. But if we apply the same principles, then enterprise software stocks leveraging their own generative AI capabilities may well be the Gorillas of the future. So, in that spirit, we are excited to present our Special Free Report on a profitable, fast-growing enterprise software stock that is already riding the automation wave and looking to catch the generative AI next.
Operating Margin
Operating margin is an important measure of profitability as it shows the portion of revenue left after accounting for all core expenses – everything from the cost of goods sold to advertising and wages. It’s also useful for comparing profitability across companies with different levels of debt and tax rates because it excludes interest and taxes.
Snap-on has been a well-oiled machine over the last five years. It demonstrated elite profitability for an industrials business, boasting an average operating margin of 25.1%. This result isn’t surprising as its high gross margin gives it a favorable starting point.
Analyzing the trend in its profitability, Snap-on’s operating margin rose by 3.5 percentage points over the last five years, as its sales growth gave it operating leverage.
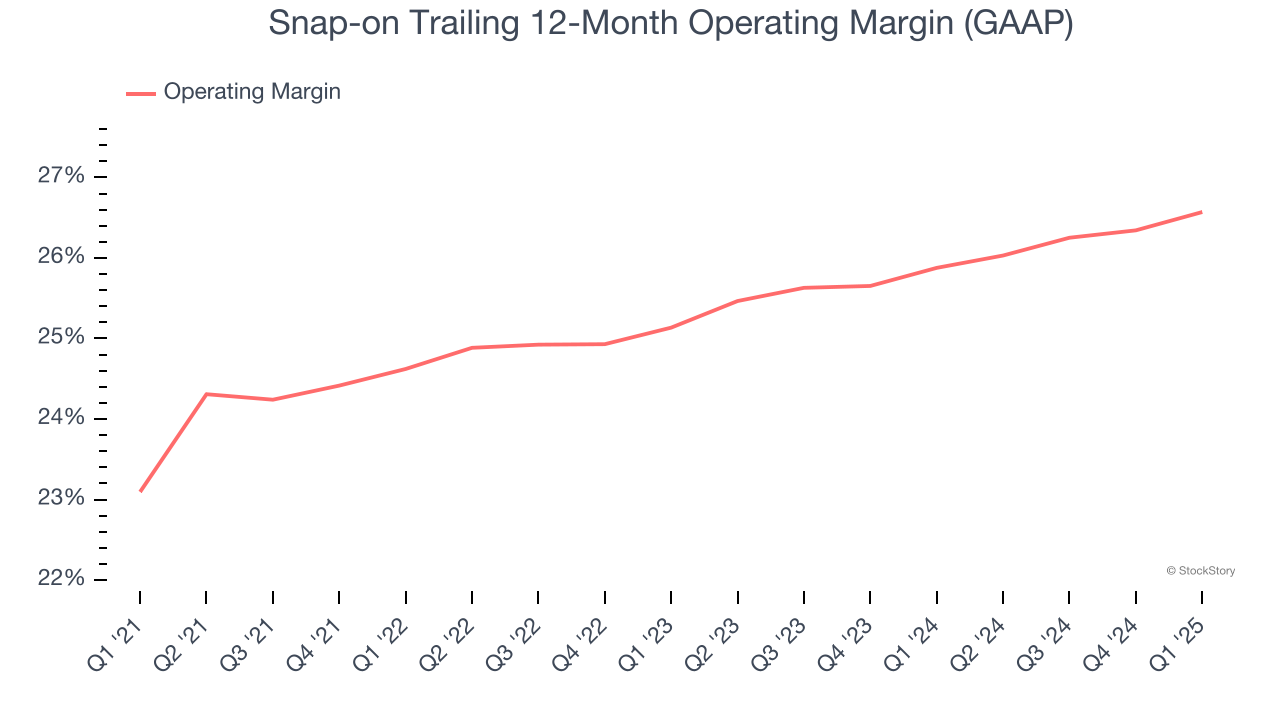
This quarter, Snap-on generated an operating profit margin of 27.5%, up 1 percentage points year on year. The increase was encouraging, and because its revenue and gross margin actually decreased, we can assume it was more efficient because it trimmed its operating expenses like marketing, R&D, and administrative overhead.
Earnings Per Share
Revenue trends explain a company’s historical growth, but the long-term change in earnings per share (EPS) points to the profitability of that growth – for example, a company could inflate its sales through excessive spending on advertising and promotions.
Snap-on’s EPS grew at a solid 10.2% compounded annual growth rate over the last five years, higher than its 4.4% annualized revenue growth. This tells us the company became more profitable on a per-share basis as it expanded.
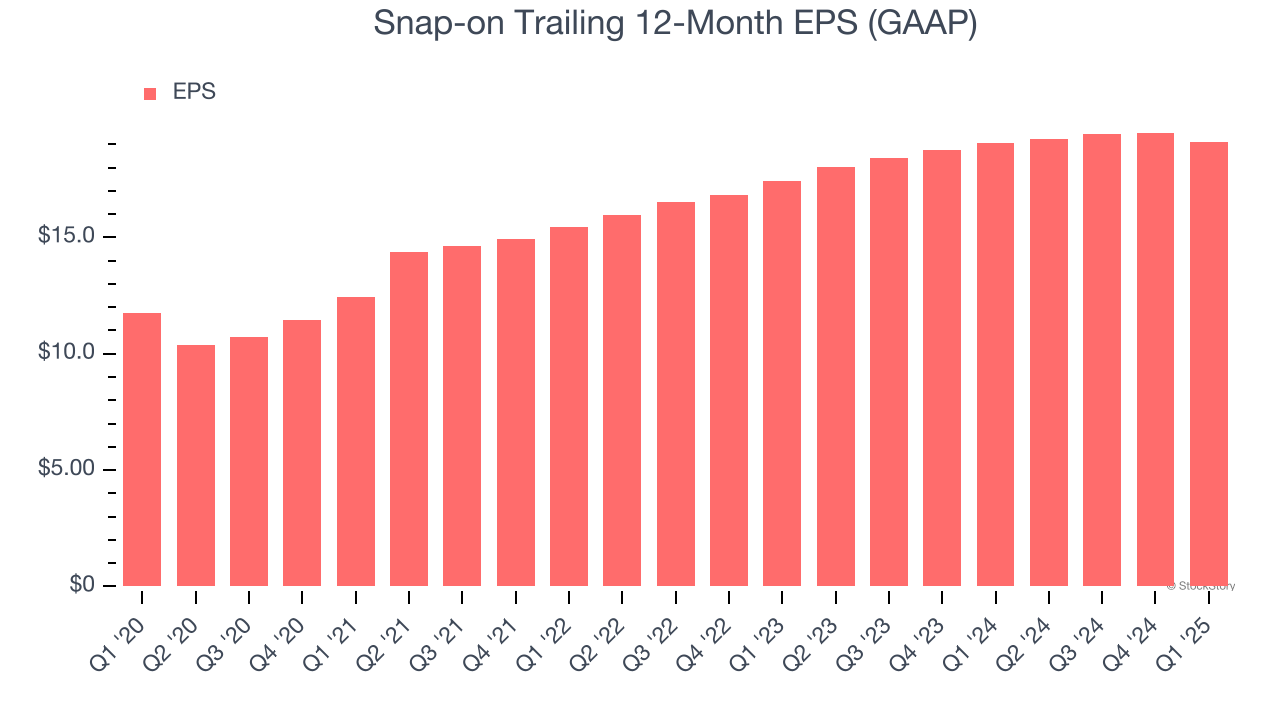
We can take a deeper look into Snap-on’s earnings to better understand the drivers of its performance. As we mentioned earlier, Snap-on’s operating margin expanded by 3.5 percentage points over the last five years. On top of that, its share count shrank by 3.2%. These are positive signs for shareholders because improving profitability and share buybacks turbocharge EPS growth relative to revenue growth. 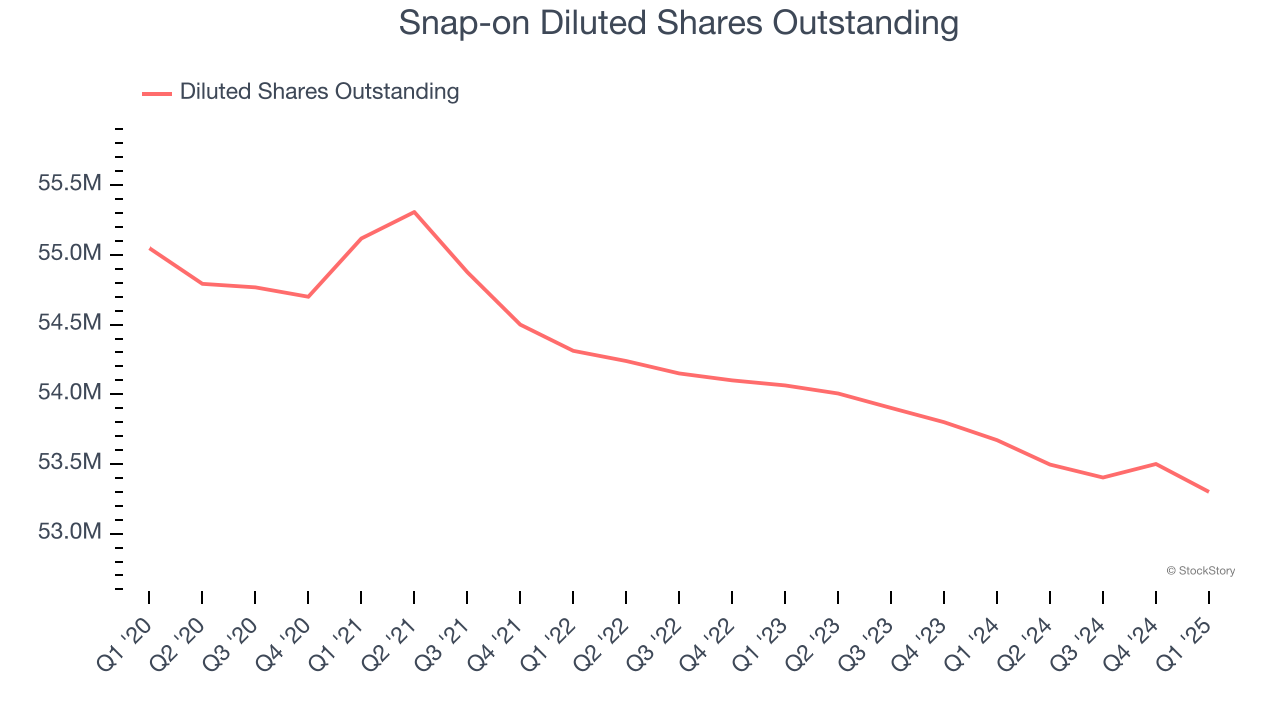
Like with revenue, we analyze EPS over a more recent period because it can provide insight into an emerging theme or development for the business.
For Snap-on, its two-year annual EPS growth of 4.7% was lower than its five-year trend. We hope its growth can accelerate in the future.
In Q1, Snap-on reported EPS at $4.51, down from $4.91 in the same quarter last year. This print missed analysts’ estimates, but we care more about long-term EPS growth than short-term movements. Over the next 12 months, Wall Street expects Snap-on’s full-year EPS of $19.11 to grow 6%.
Key Takeaways from Snap-on’s Q1 Results
We struggled to find many positives in these results. Its revenue missed significantly and its EPS fell short of Wall Street’s estimates. Overall, this was a weaker quarter. The stock traded down 2.2% to $324.78 immediately after reporting.
Snap-on’s latest earnings report disappointed. One quarter doesn’t define a company’s quality, so let’s explore whether the stock is a buy at the current price. When making that decision, it’s important to consider its valuation, business qualities, as well as what has happened in the latest quarter. We cover that in our actionable full research report which you can read here, it’s free.


