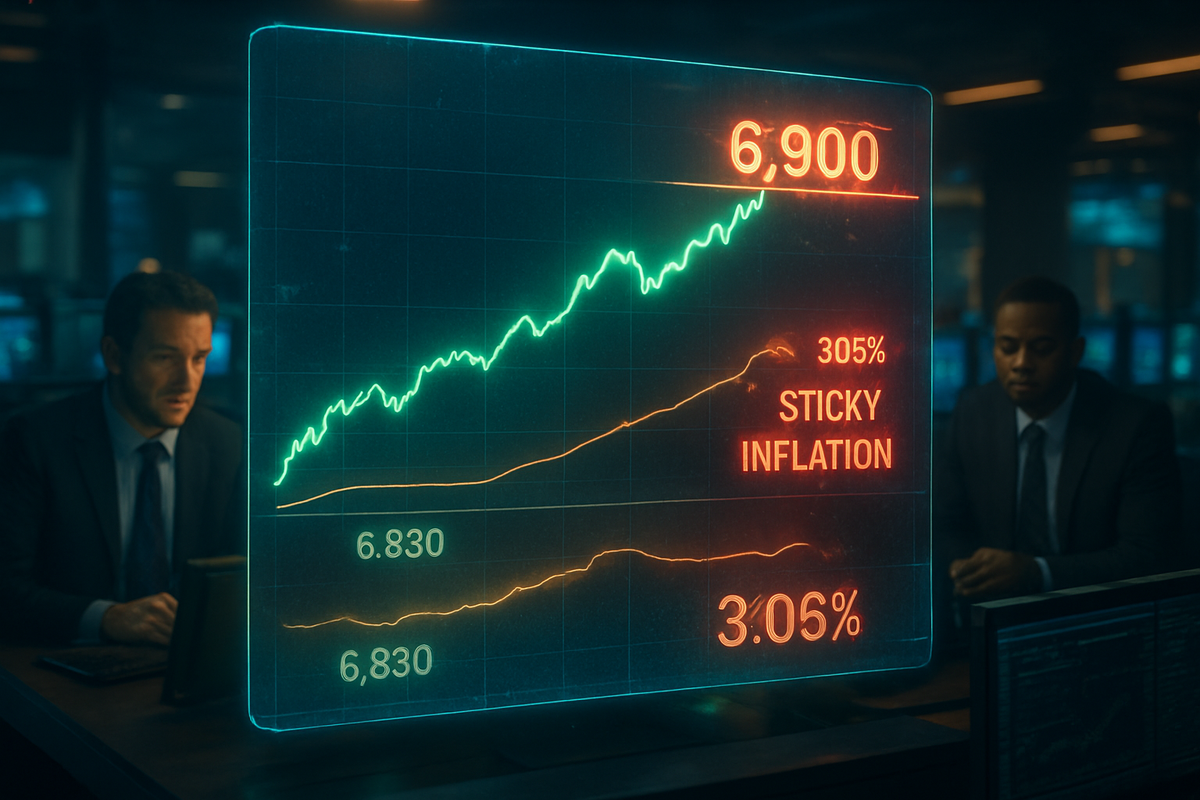
The S&P 500 (INDEXSP: .INX) is currently locked in a high-stakes tug-of-war at the critical 6,900 resistance level, as the early-year momentum that propelled markets to historic highs in January begins to evaporate. Investors are grappling with a confluence of technical fatigue and macroeconomic headwinds, specifically a "sticky" inflation narrative that refuses to subside. As the index hovers just above its 50-day moving average, the market is showing classic signs of "late-February exhaustion," a seasonal phenomenon where the bullish fervor of the new year is replaced by institutional profit-taking and defensive repositioning.
The immediate implications of this stalemate are significant for both retail and institutional portfolios. A failure to hold the 6,900 level could trigger a technical cascade, potentially pushing the index down toward its critical support at the 50-day moving average of 6,830. With the market already on edge following recent consumer price data, any further signs of technical weakness could transform a standard seasonal retracement into a deeper correction, testing the resolve of a bull market that has been largely driven by artificial intelligence speculation and hopes for a definitive "soft landing."
The current technical impasse at 6,900 is the culmination of a volatile eight-week stretch that began with a jubilant surge in early January. After the S&P 500 briefly touched the psychological milestone of 7,000 on January 28, 2026, the rally hit a metaphorical brick wall. Since then, the index has undergone a series of "lower highs," signaling that the buying pressure from the turn of the year has significantly diminished. This stall coincided with the release of mid-February inflation data, which showed Year-over-Year (YoY) CPI hovering at 3.05%—stubbornly above the Federal Reserve’s 2% target and higher than most analysts had projected for the first quarter of 2026.
This "sticky inflation" has forced a dramatic repricing of interest rate expectations. Throughout late 2025, market participants had baked in a series of aggressive rate cuts for the spring of 2026; however, those expectations are now being deferred into the second half of the year. The timeline of this shift has created a "policy beta" environment where equity prices are reacting more to Federal Open Market Committee (FOMC) rhetoric than to individual corporate performance. The reaction in the bond market has been equally swift, with the 10-year Treasury yield creeping back toward levels that threaten the valuation premiums currently enjoyed by mega-cap technology stocks.
In this environment of exhaustion, the market’s heavyweights are facing disparate fates. Nvidia (NASDAQ: NVDA), which remains the primary engine of the S&P 500’s growth, is at a pivotal juncture as it reports earnings today, February 25, 2026. Despite its $4.8 trillion market cap, the stock has struggled to lead in recent weeks, rising only marginally YTD. A "beat and raise" might provide the spark needed to reclaim 6,900, but an "IV crush" or a merely "good" report could see the stock—and by extension, the SPDR S&P 500 ETF Trust (NYSEARCA: SPY)—dragged down by the broader seasonal trend.
Conversely, established giants like Apple Inc. (NASDAQ: AAPL) and Microsoft Corp. (NASDAQ: MSFT) have already begun to show signs of defensive strain. Apple has faced a difficult start to 2026, with shares down approximately 3.5% as investors rotate out of hardware-heavy tech and into "real-economy" sectors like Energy and Industrials. Microsoft has similarly underperformed the broader index as the market begins to demand more tangible returns on the massive AI infrastructure investments of 2024 and 2025. On the winning side, defensive exchange-traded funds and value-oriented sectors could see inflows as investors seek shelter from the tech-heavy volatility of the Vanguard S&P 500 ETF (NYSEARCA: VOO).
The current market behavior fits into a broader historical trend known as the "late-February fade." Data from the last two decades suggests that the S&P 500 frequently forms an intermediate top between February 14 and 15, followed by a period of bearish consolidation that can last until the third week of March. This year, the trend is being exacerbated by late-cycle economic dynamics, where high labor costs and persistent service-sector inflation are beginning to squeeze profit margins across the board. The 2026 scenario bears a striking resemblance to the market environment of early 2020 and late 2022, where technical overextension met a fundamental shift in the macro landscape.
Regulatory and policy implications also loom large. If inflation remains "stuck" at 3%, the Federal Reserve may be forced to maintain a "restrictive for longer" stance, which could fundamentally alter the equity risk premium for the next 18 months. Historically, when the S&P 500 trades at a forward P/E ratio exceeding 22x while inflation is above 3%, the market eventually undergoes a "valuation reset" to bring multiples back in line with historical averages. This systemic risk is what is currently keeping institutional buyers on the sidelines as the index tests the 6,900 ceiling.
Looking ahead, the next several trading sessions will be decisive. The short-term focus remains squarely on the 6,830 support level—the 50-day moving average. A decisive close below this mark would likely embolden short-sellers and trigger algorithmic "sell programs," potentially targeting the 6,700 level before a bottom is found. However, if Nvidia’s earnings act as a catalyst and the index can clear 6,950 with high volume, the "exhaustion" may prove to be a temporary pause before a run at new all-time highs above 7,100 in April, which is seasonally one of the strongest months for equities.
Strategic pivots are already underway among major hedge funds, with a noticeable shift toward "quality" and "cash-flow" over "growth at any price." Investors should be prepared for a period of heightened volatility (VIX) as the market digests the reality that the "easy money" of the early-decade recovery may be over. Market opportunities may emerge in mid-cap sectors and international markets that have not seen the same level of overextension as the U.S. large-cap tech sector, providing a necessary hedge for diversified portfolios.
To summarize, the S&P 500 is currently at a technical crossroads that will define the trajectory of the market for the first half of 2026. The 6,900 resistance level represents a psychological and technical barrier that has proven difficult to overcome amidst sticky inflation and seasonal fatigue. The critical support at 6,830 remains the "line in the sand" for bulls; a breach here would signal that the seasonal retracement has more room to run, potentially into the latter half of March.
Moving forward, investors should watch for the resolution of the Nvidia earnings catalyst and any upcoming commentary from Fed officials regarding the "sticky" CPI data. While the long-term bull case for the S&P 500 remains intact due to the transformative power of AI and a resilient labor market, the immediate term demands caution. The "late-February exhaustion" is a reminder that even the strongest rallies need to breathe, and a healthy retracement now might be the very thing needed to sustain the market’s climb later in the year.
This content is intended for informational purposes only and is not financial advice.