
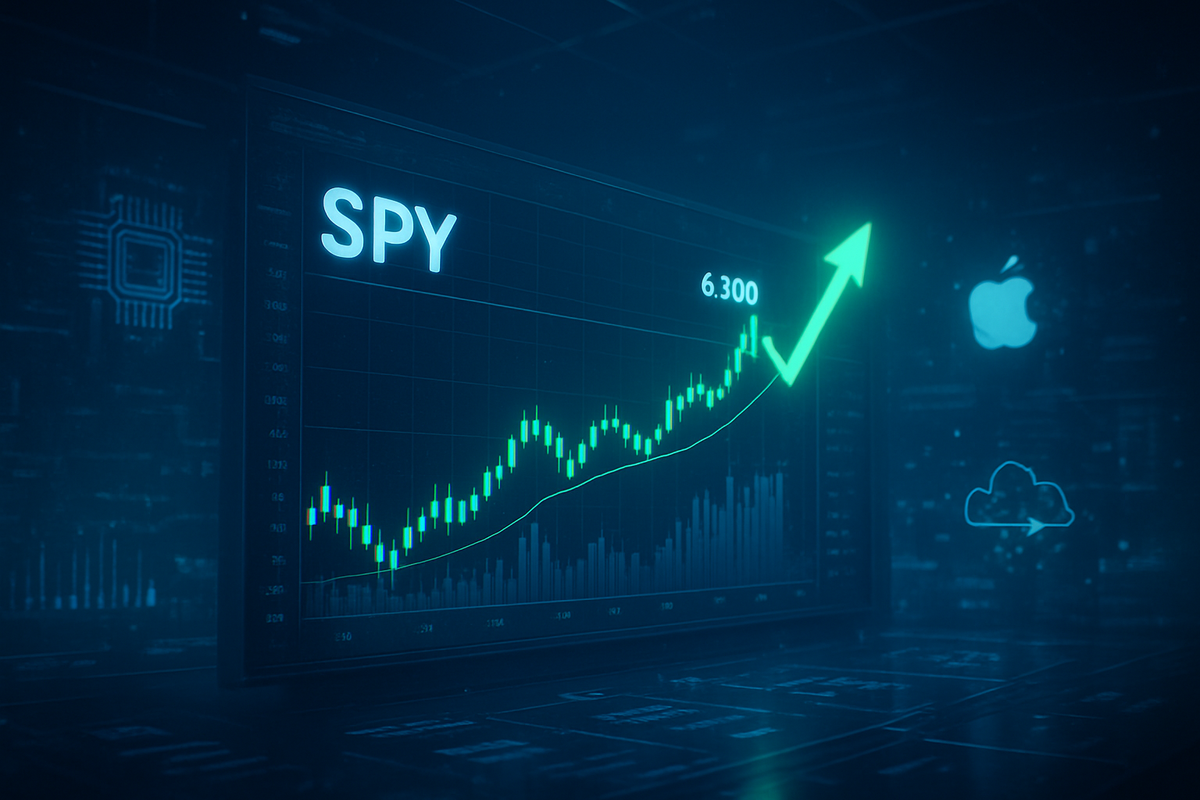
As the markets head into the final days of 2025, the S&P 500 ETF Trust (NYSE Arca: SPY) has achieved a milestone that many analysts deemed ambitious just twelve months ago. On December 24, 2025, the index closed at a staggering record high of 6,909.79, punctuated by a technical breakout that signals both immense momentum and a market potentially stretched to its limits. This rally, fueled by the maturation of artificial intelligence (AI) integration and a resilient domestic economy, has pushed the benchmark index up nearly 15% for the year, following the historic gains of 2023 and 2024.
The immediate implications of this breakout are profound for institutional and retail investors alike. Technically, the SPY has cleared a major psychological and mathematical resistance zone between 6,850 and 6,900. While the "Santa Claus rally" is a seasonal staple, the 2025 version is backed by a robust Average Directional Index (ADX) of 42.9, suggesting that the current trend is exceptionally strong. However, with the Relative Strength Index (RSI) currently hovering at 72.9, the market is firmly in overbought territory, raising questions about whether this breakout is a sustainable launchpad for 7,000 or a "blow-off top" preceding a Q1 2026 correction.
The Road to 6,900: A Technical Journey
The journey to this record high began in earnest in late 2024, when the S&P 500 first breached the 6,000 level. Throughout 2025, the index followed a disciplined ascending channel, consistently finding support at its 50-day Simple Moving Average (SMA), which currently sits near 6,560. The timeline of this breakout was catalyzed by a series of "higher lows" established during the summer months, specifically at the 5,875 and 6,200 levels, which now serve as critical structural support. The Moving Average Convergence Divergence (MACD) indicator has remained in a bullish posture for most of the fourth quarter, with the current reading of 24.1 reflecting strong upward acceleration.
Key stakeholders in this rally include major institutional asset managers and the Federal Reserve, whose "terminal rate" guidance has been the North Star for equity valuations. The market's reaction to the December breakout has been one of cautious exuberance; while volume has remained steady, the "negative divergence" that some technicians feared in November—where price hits new highs but momentum indicators lag—has largely been invalidated by the late-December surge. This suggests that the buying pressure is not just a result of low-liquidity holiday trading but a genuine re-rating of corporate earnings potential.
The $4 Trillion Club: Winners and Losers in the Breakout
The primary drivers of this historic breakout have been the "Big Three" of the technology sector, all of which are now vying for or have surpassed the unprecedented $4 trillion market capitalization mark. Nvidia (NASDAQ: NVDA) continues to be the undisputed leader of the pack, with its stock projected to end 2025 with a gain of over 36%. As the primary "AI enabler," Nvidia’s hardware remains the bedrock of the global computing shift. Similarly, Apple (NASDAQ: AAPL) reached its $4 trillion milestone in October 2025, driven by the mass adoption of "Apple Intelligence" across its hardware ecosystem, while Microsoft (NASDAQ: MSFT) has leveraged its Azure cloud dominance to maintain a steady 15% revenue growth rate, securing its spot at the top of the index.
However, the 2025 rally has been more than just a mega-cap tech story. The "S&P 493"—the remaining companies in the index—began to participate more meaningfully in the second half of the year. Financials and Industrials have seen a boost from deregulation and tax-cut expectations under the current administration's fiscal policies. Conversely, the "losers" in this environment have been sectors sensitive to "sticky" inflation and high bond yields. As the 10-year Treasury yield hovered between 4.50% and 4.75% in late 2025, traditional Utilities and highly leveraged Real Estate Investment Trusts (REITs) have struggled to keep pace with the broader market's double-digit gains.
AI Adoption and the "Trump 2.0" Paradigm
The wider significance of the SPY's breakout to 6,900 fits into a broader shift from AI experimentation to AI implementation. Unlike the dot-com bubble of the late 1990s, the current rally is supported by tangible earnings growth, with S&P 500 earnings per share (EPS) growing at an estimated 11-13% in 2025. This event also reflects the market's digestion of "Trump 2.0" economic policies. While the prospect of further corporate tax cuts has acted as a tailwind for equities, the implementation of aggressive tariffs has introduced a layer of complexity, stoking fears of inflationary pressure that could force the Federal Reserve to pause its easing cycle in early 2026.
Historically, the current two-year run is the strongest the market has seen since the 1990s. The ripple effects are being felt globally, as capital continues to flow into U.S. equities, often at the expense of emerging markets. Regulatory shifts toward deregulation have further emboldened the banking sector, with major players benefiting from a more lenient oversight environment. However, the precedent of 1999 serves as a warning: when technical indicators like the RSI stay in the 70s for extended periods, the eventual reversion to the mean can be sharp and unforgiving.
What Lies Ahead: The Path to 7,100 or a Q1 Pullback?
Looking toward 2026, the short-term outlook remains tethered to the 6,900 support level. If the SPY can hold this ground during the January "rebalancing" period, the next technical target is the 7,100 resistance zone, which many Wall Street firms, including Deutsche Bank and Yardeni Research, have set as their high-end targets. However, a strategic pivot may be required if inflation data in January comes in hotter than expected. Investors should be prepared for potential scenarios where the Fed adopts a "hawkish hold," which could see the SPY retreat to test its secondary support levels between 6,400 and 6,500.
Market opportunities are likely to emerge in "AI adopters"—companies in healthcare and manufacturing that are successfully using technology to expand margins—rather than just the chipmakers. The challenge for 2026 will be navigating the transition from a momentum-driven market to one focused on valuation discipline. As the "Magnificent Seven" reach valuation levels that leave little room for error, any earnings miss could trigger a volatility spike (VIX) that has been largely absent during the steady climb of 2025.
Conclusion: A Year of Records and the Vigilance Ahead
The S&P 500’s close at 6,909.79 on Christmas Eve 2025 marks a historic achievement in financial history, capping off a year where American corporate resilience and technological innovation defied skeptical forecasts. The key takeaways for investors are the sheer strength of the current trend, as evidenced by the ADX and MACD, and the broadening of the rally beyond a few tech giants. However, the "overbought" RSI serves as a reminder that the market rarely moves in a straight line forever.
Moving forward, the market remains in a "buy the dip" regime, but with increasing necessity for selectivity. Investors should watch the 10-year Treasury yield and the Federal Reserve's January meeting closely, as these will be the primary catalysts for either a continuation toward 7,100 or a much-needed period of consolidation. As we enter 2026, the mantra for the market is clear: the trend is your friend, but keep your eyes on the exit signs.
This content is intended for informational purposes only and is not financial advice.


