
Microsoft Corp (MSFT) produced 33% higher free cash flow for the quarter ending Sept. 30. Moreover, it generated a strong 33.3% FCF margin after heavy AI capex. This implies it could hit a $5 trillion mkt cap over the next year, or +33% higher.
Shorting out-of-the-money puts is an attractive way to play the stock. I discussed this in my last Barchart article on Oct. 14, “Shorting Microsoft Out-of-the-Money Put Options Works Well for Defensive Investors.”
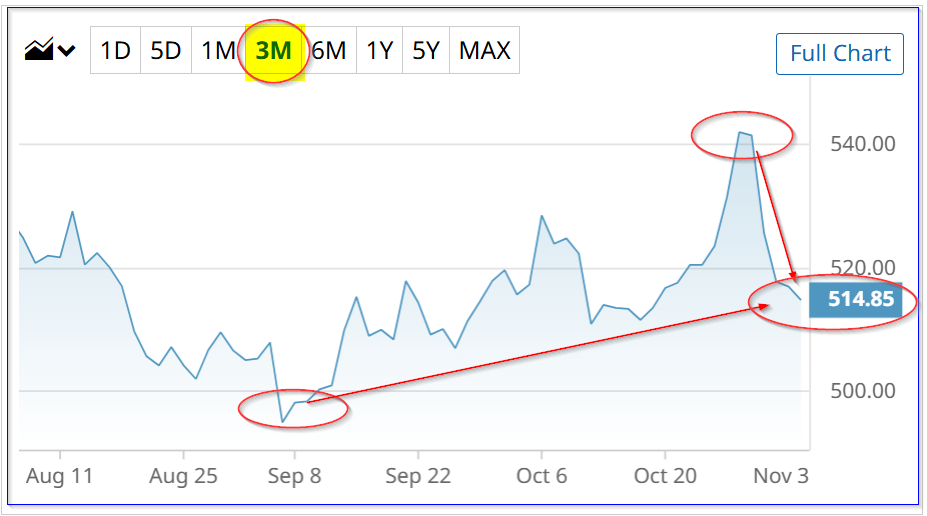
MSFT is at $513.58 in midday trading on Tuesday, Nov. 4. That is well below its recent high of $542.07 on Oct. 28, but up from the Sep. 5 low of $495.00.
If Microsoft can continue to generate strong free cash flow margins on analysts' higher revenue forecasts, MSFT stock could rise one-third higher to $683 per share. This article will show why.
Strong FCF Generation
On Oct. 29, Microsoft reported that its fiscal Q1 2026 revenue rose +18% YoY to $77.7 billion and its free cash flow (FCF) was up 33.3% to $25.663 billion during the quarter.
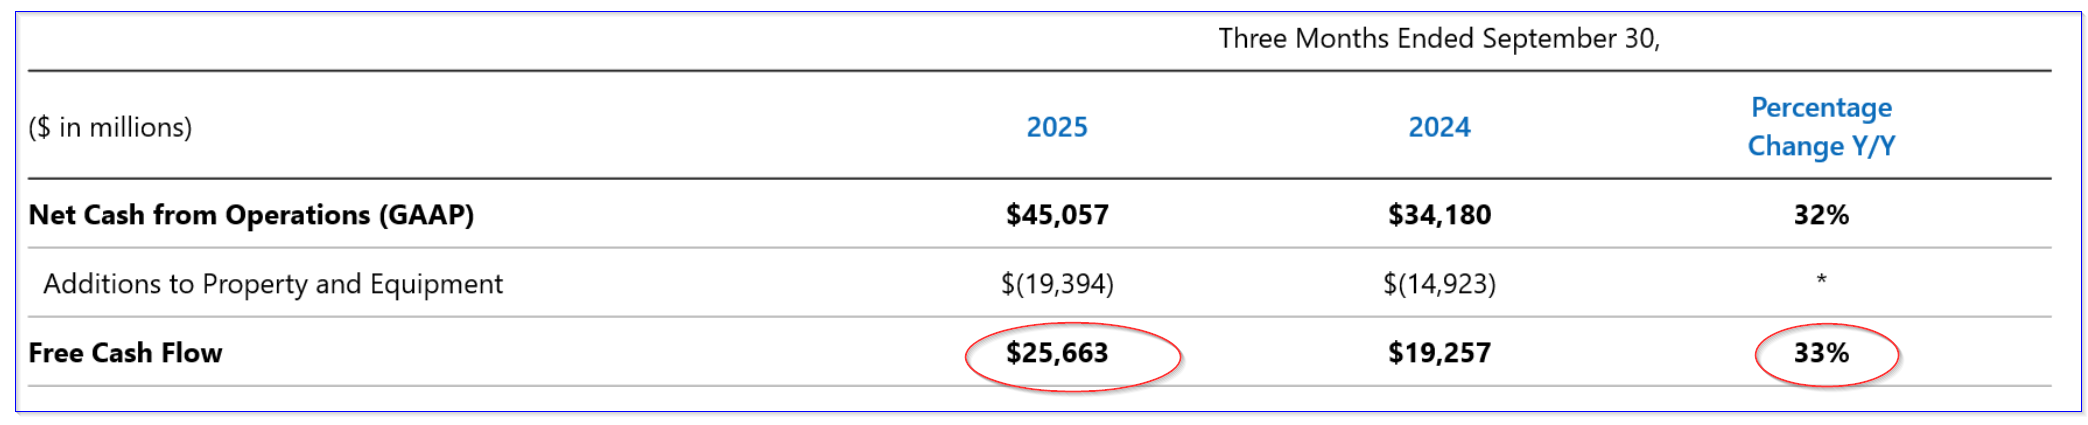
That was after capex spending rose 30% over the past year. Microsoft is continuing to invest in AI-related projects and its cloud computing capacity.
As a result, its Q1 2026 FCF margin (FCF/revenue) remained strong at 33.04%, according to Stock Analysis, compared with 29.36% a year ago. However, last quarter, its FCF margin was slightly higher at 33.45%.
Nevertheless, over the trailing 12 months (TTM), Microsoft has generated 26.55% of revenue as free cash flow. That compares with 25.42% last quarter on a TTM basis.
We can use these figures to estimate its FCF over the next 12 months (NTM).
Forecasting NTM FCF
First, let's estimate the NTM revenue. For example, analysts are forecasting that revenue for the year ending June 30, 2026, will be $326.70 billion. Given that Q1 2026 revenue is already declared, let's use 3/4ths of this FY 2026 estimate and ¼ of the following year's forecast of $374.88 billion, to estimate NTM revenue:
0.75 x $326.70 billion + 0.25 x $374.88 billion = $245.025b + $93.72b = $338.745 billion NTM revenue
Next, let's use an average FCF margin from the past quarter and the TTM margins (i.e., 33.04% and 26.55%):
(33.04% + 26.55%) / 2 = 55.59%/2 = 29.795%, or approximately a 30% FCF margin
Therefore, applying a 30% margin to the NTM FCF forecast:
30% x $338.745 billion = $101.62 billion FCF
That would be +30% higher than the $78 billion in FCF it generated over the last 12 months, according to Stock Analysis.
That could push MSFT 30% higher.
Price Targets for MSFT Stock
For example, based on Microsoft's $3.824 trillion market cap today, according to Yahoo! Finance, its TTM FCF of $78 billion represents a 2.0% FCF yield:
$78b/ $3,824b = 0.02 = 2.0% FCF yield
Therefore, applying this FCF yield to our NTM FCF forecast, Microsoft could end up with a $5 trillion market value:
$101.62b / 0.02 = $5,081 billion
That is 32.9% higher than today's market cap. In other words, MSFT stock could be worth:
$513.58 x 1.329 = $682.55 per share target price +32.9%
Analysts tend to agree with this. For example, Yahoo! Finance reports that 57 analysts have an average price target of $626.71 per share. Barchart's survey shows a mean target of $632.77.
Moreover, AnaChart.com shows that 28 analysts have an average price of $590.61. So, the average of these three surveys is $616.70, or +20% over today's price.
One way to play this, as mentioned earlier, is to set a lower buy-in price target by shorting out-of-the-money (OTM) put options in nearby expiry periods.
Shorting OTM MSFT Puts
For example, the Dec. 5, 2025, expiry period, 31 days away, shows that the $500.00 put option strike price has an attractive premium of $7.10 per put contract. That means a short-seller of these puts can make an immediate yield of 1.42%:
$7.10 / $500.00 = 0.0142 = 1.42% one-month yield
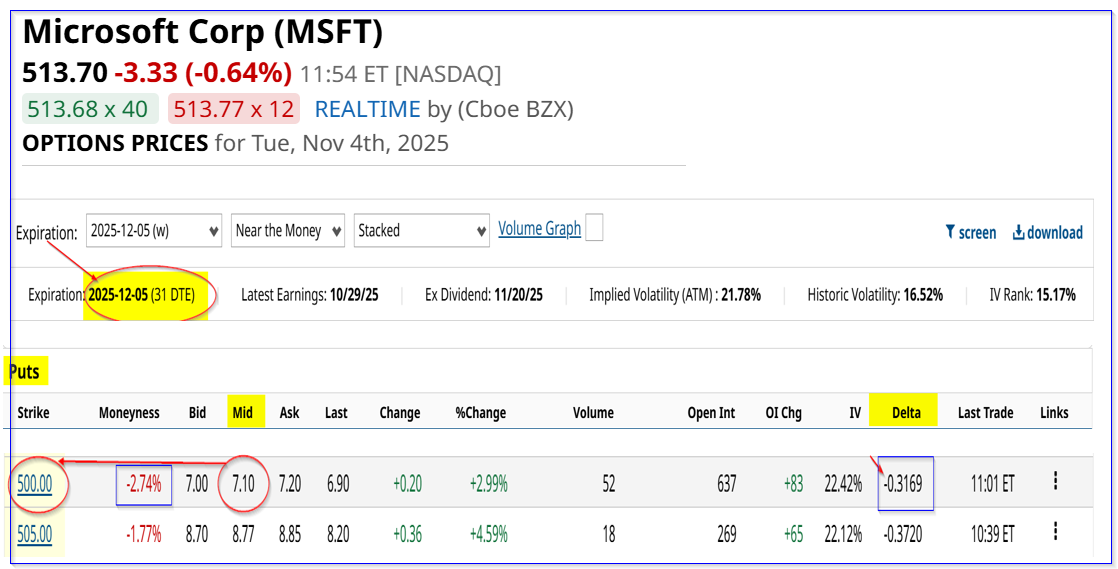
This also sets the breakeven point (i.e., $500 - $7.10) at $492.90, or 4% below today's price. That is an attractive potential buy-in, if MSFT falls to $500 over the next month.
Moreover, the upside is better than owning shares:
$682.55/$492.90 = 1.385 -1 = +38.5%
The upside using our price target is better than the +32.9% upside of owning MSFT shares outright.
The bottom line is that MSFT looks cheap here, and shorting OTM puts is an attractive way to play it.
On the date of publication, Mark R. Hake, CFA did not have (either directly or indirectly) positions in any of the securities mentioned in this article. All information and data in this article is solely for informational purposes. For more information please view the Barchart Disclosure Policy here.
More news from Barchart
- Microsoft Produces Strong FCF As Expected - Shorting OTM Puts is an Attractive Play
- Use This Options Strategy as a ‘Side Hustle’ to Generate Steady Income in Retirement
- In a Golden Era of Covered Call ETFs, Don’t Miss This 1 Overlooked Fund
- Bull Put Spread Provides Opportunities for Long-Term Microsoft Bulls


