
The semiconductor industry is experiencing an upsurge due to increasing chip usage in transformative technologies. According to the Semiconductor Industry Association (SIA), global semiconductor sales for September increased 1.9% month-over-month.
Amid this conducive market trend, NXP Semiconductors N.V. (NXPI) is set to release its third-quarter results today. The company had forecasted robust results for the to-be-reported quarter, expecting automakers to ramp production, which would offset the hit from a weak consumer electronics market.
The company forecast third-quarter non-GAAP revenue between $3.30 billion and $3.50 billion, compared to the analyst estimate of $3.31 billion. NXPI expects non-GAAP EPS to be between $3.39 and $3.82, while analysts expected $3.43.
Given such conducive figures, let’s look at the trends of NXPI’s key financial metrics to understand why it might be wise to invest in the stock now.
Analysis of NXP Semiconductors' Financial Performance and Market Prospect from 2020 to 2023
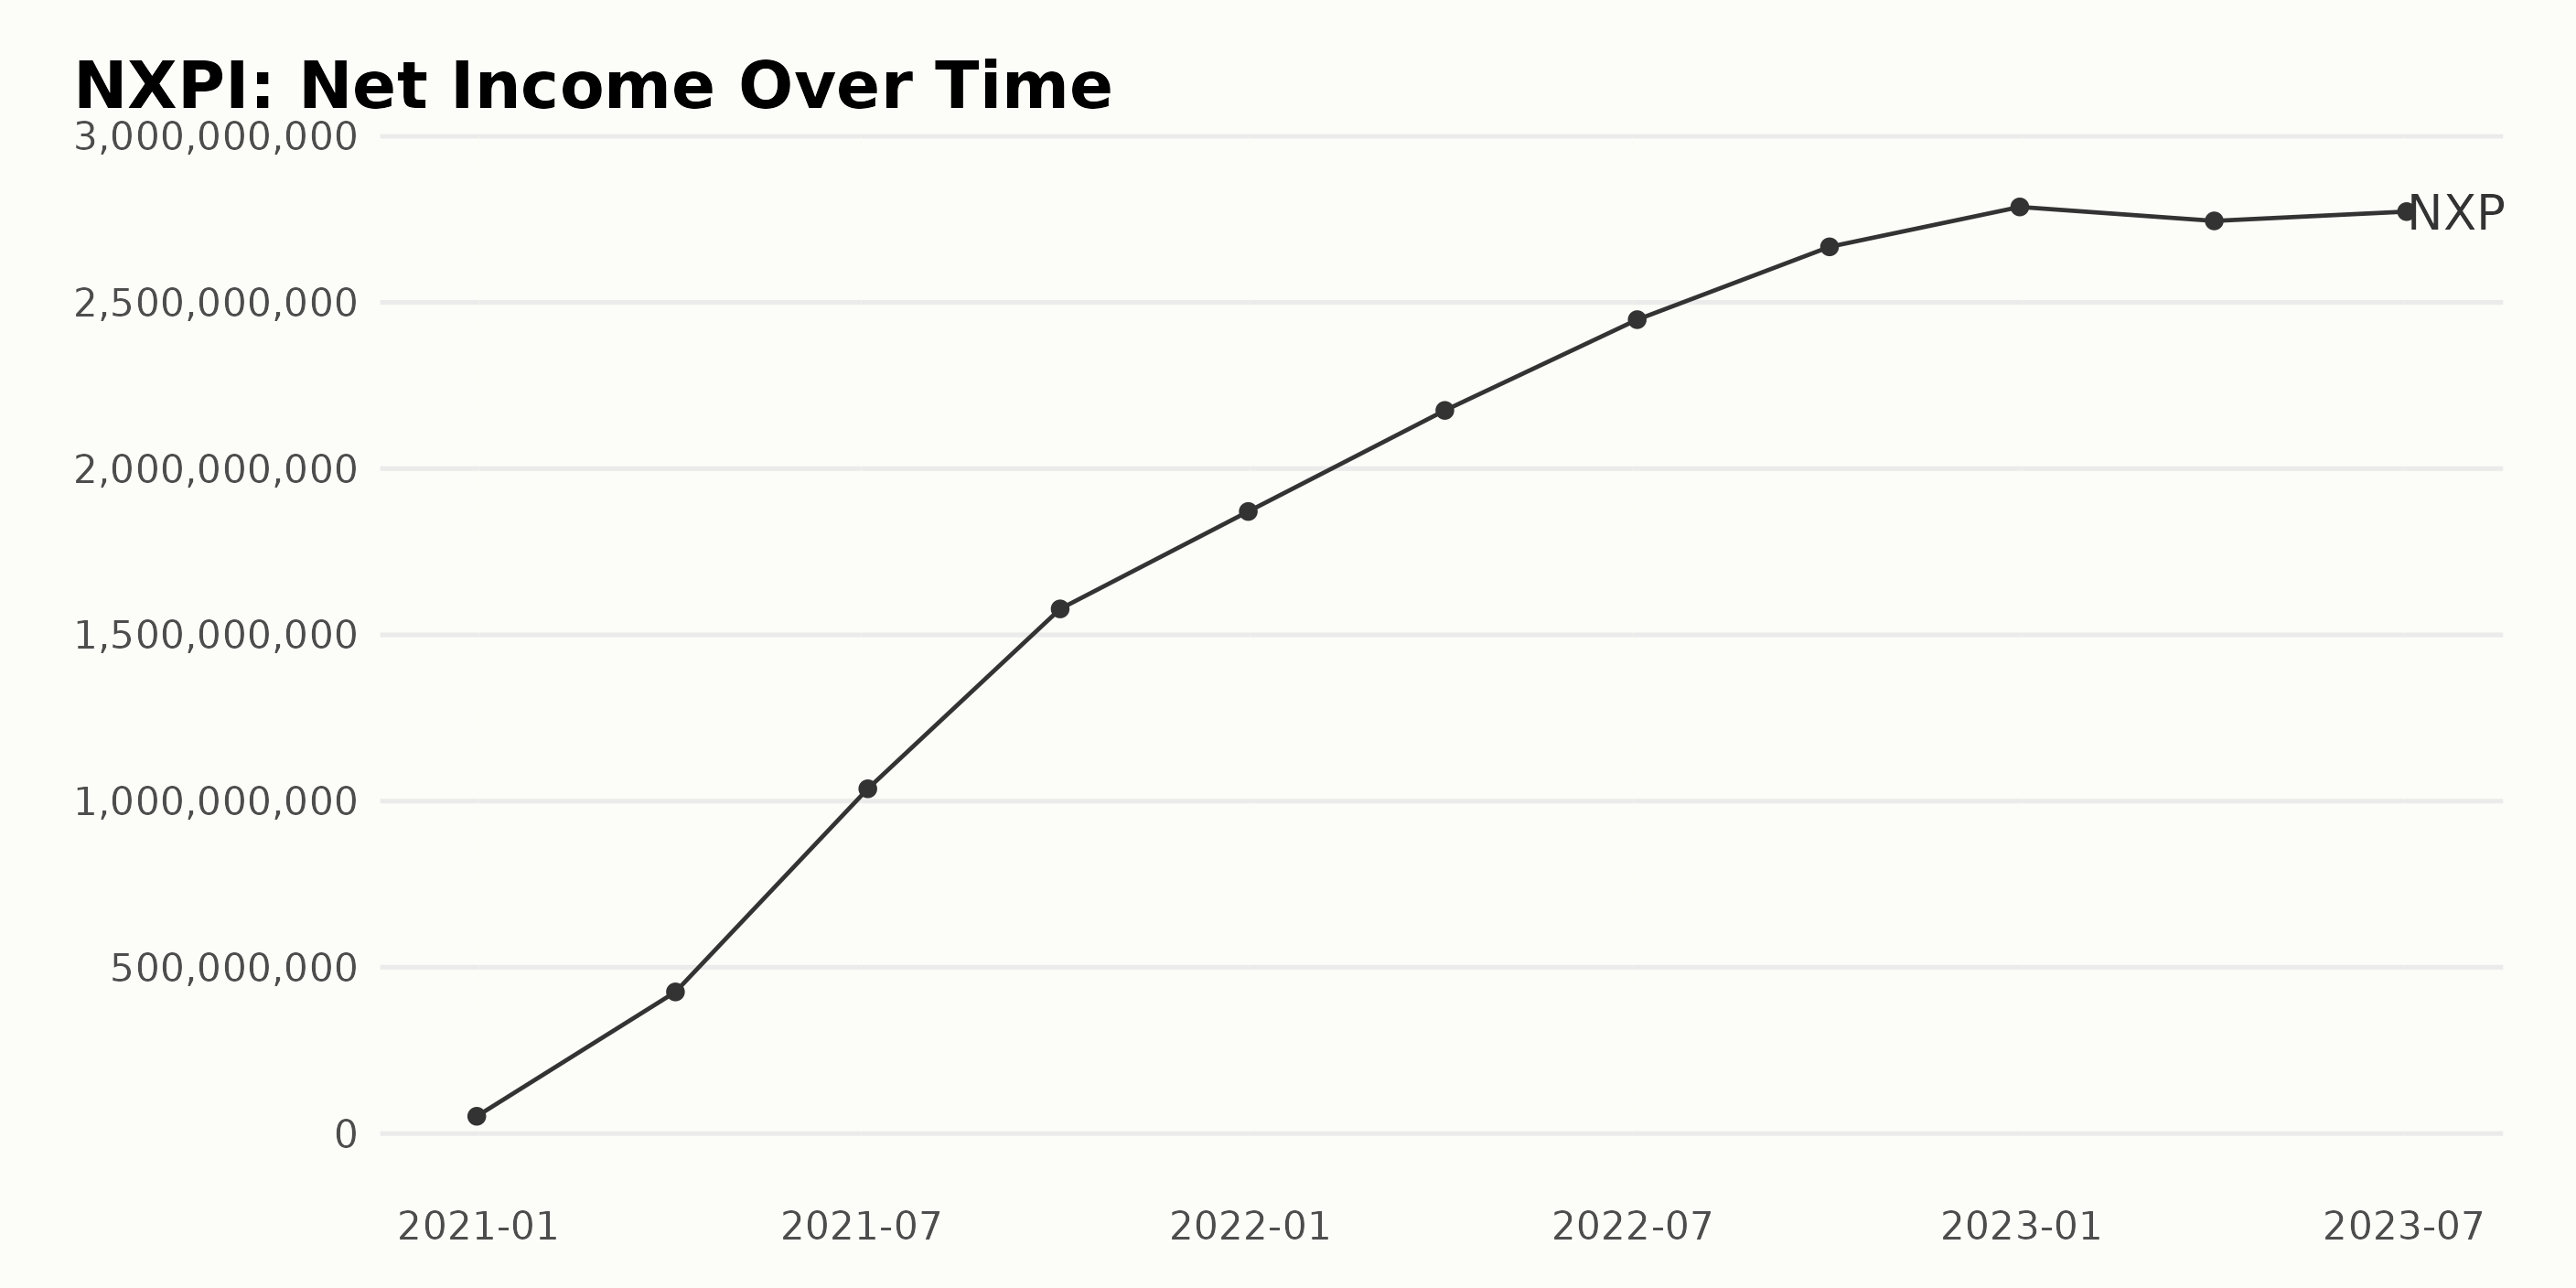
The trailing-12-month net income of NXPI has demonstrated strong growth and a positive trend since the end of 2020. Here are the key points of analysis:
- On December 31, 2020, the net income was $52 million.
- There were considerable increases over the course of 2021, with the net income recorded at $426 million in April, growing significantly to $1.04 billion by July, and finally ending the year at $1.87 billion as of December 31.
- Continuing the upward trajectory into 2022, the net income grew from 1.87 billion at the beginning of the year to reach a peak of $2.79 billion by December 31, 2022.
- This pace of growth continued into the first half of 2023, when the net income was reported as $2.74 billion in April, then slightly increased to $2.77 billion by July.
By comparing the first recorded value on December 31, 2020, with the latest on July 2, 2023, there's an increase in net income by approximately 5,223%, signaling substantial growth for NXPI. However, the growth rate has slowly decelerated since peaking at the end of 2022.
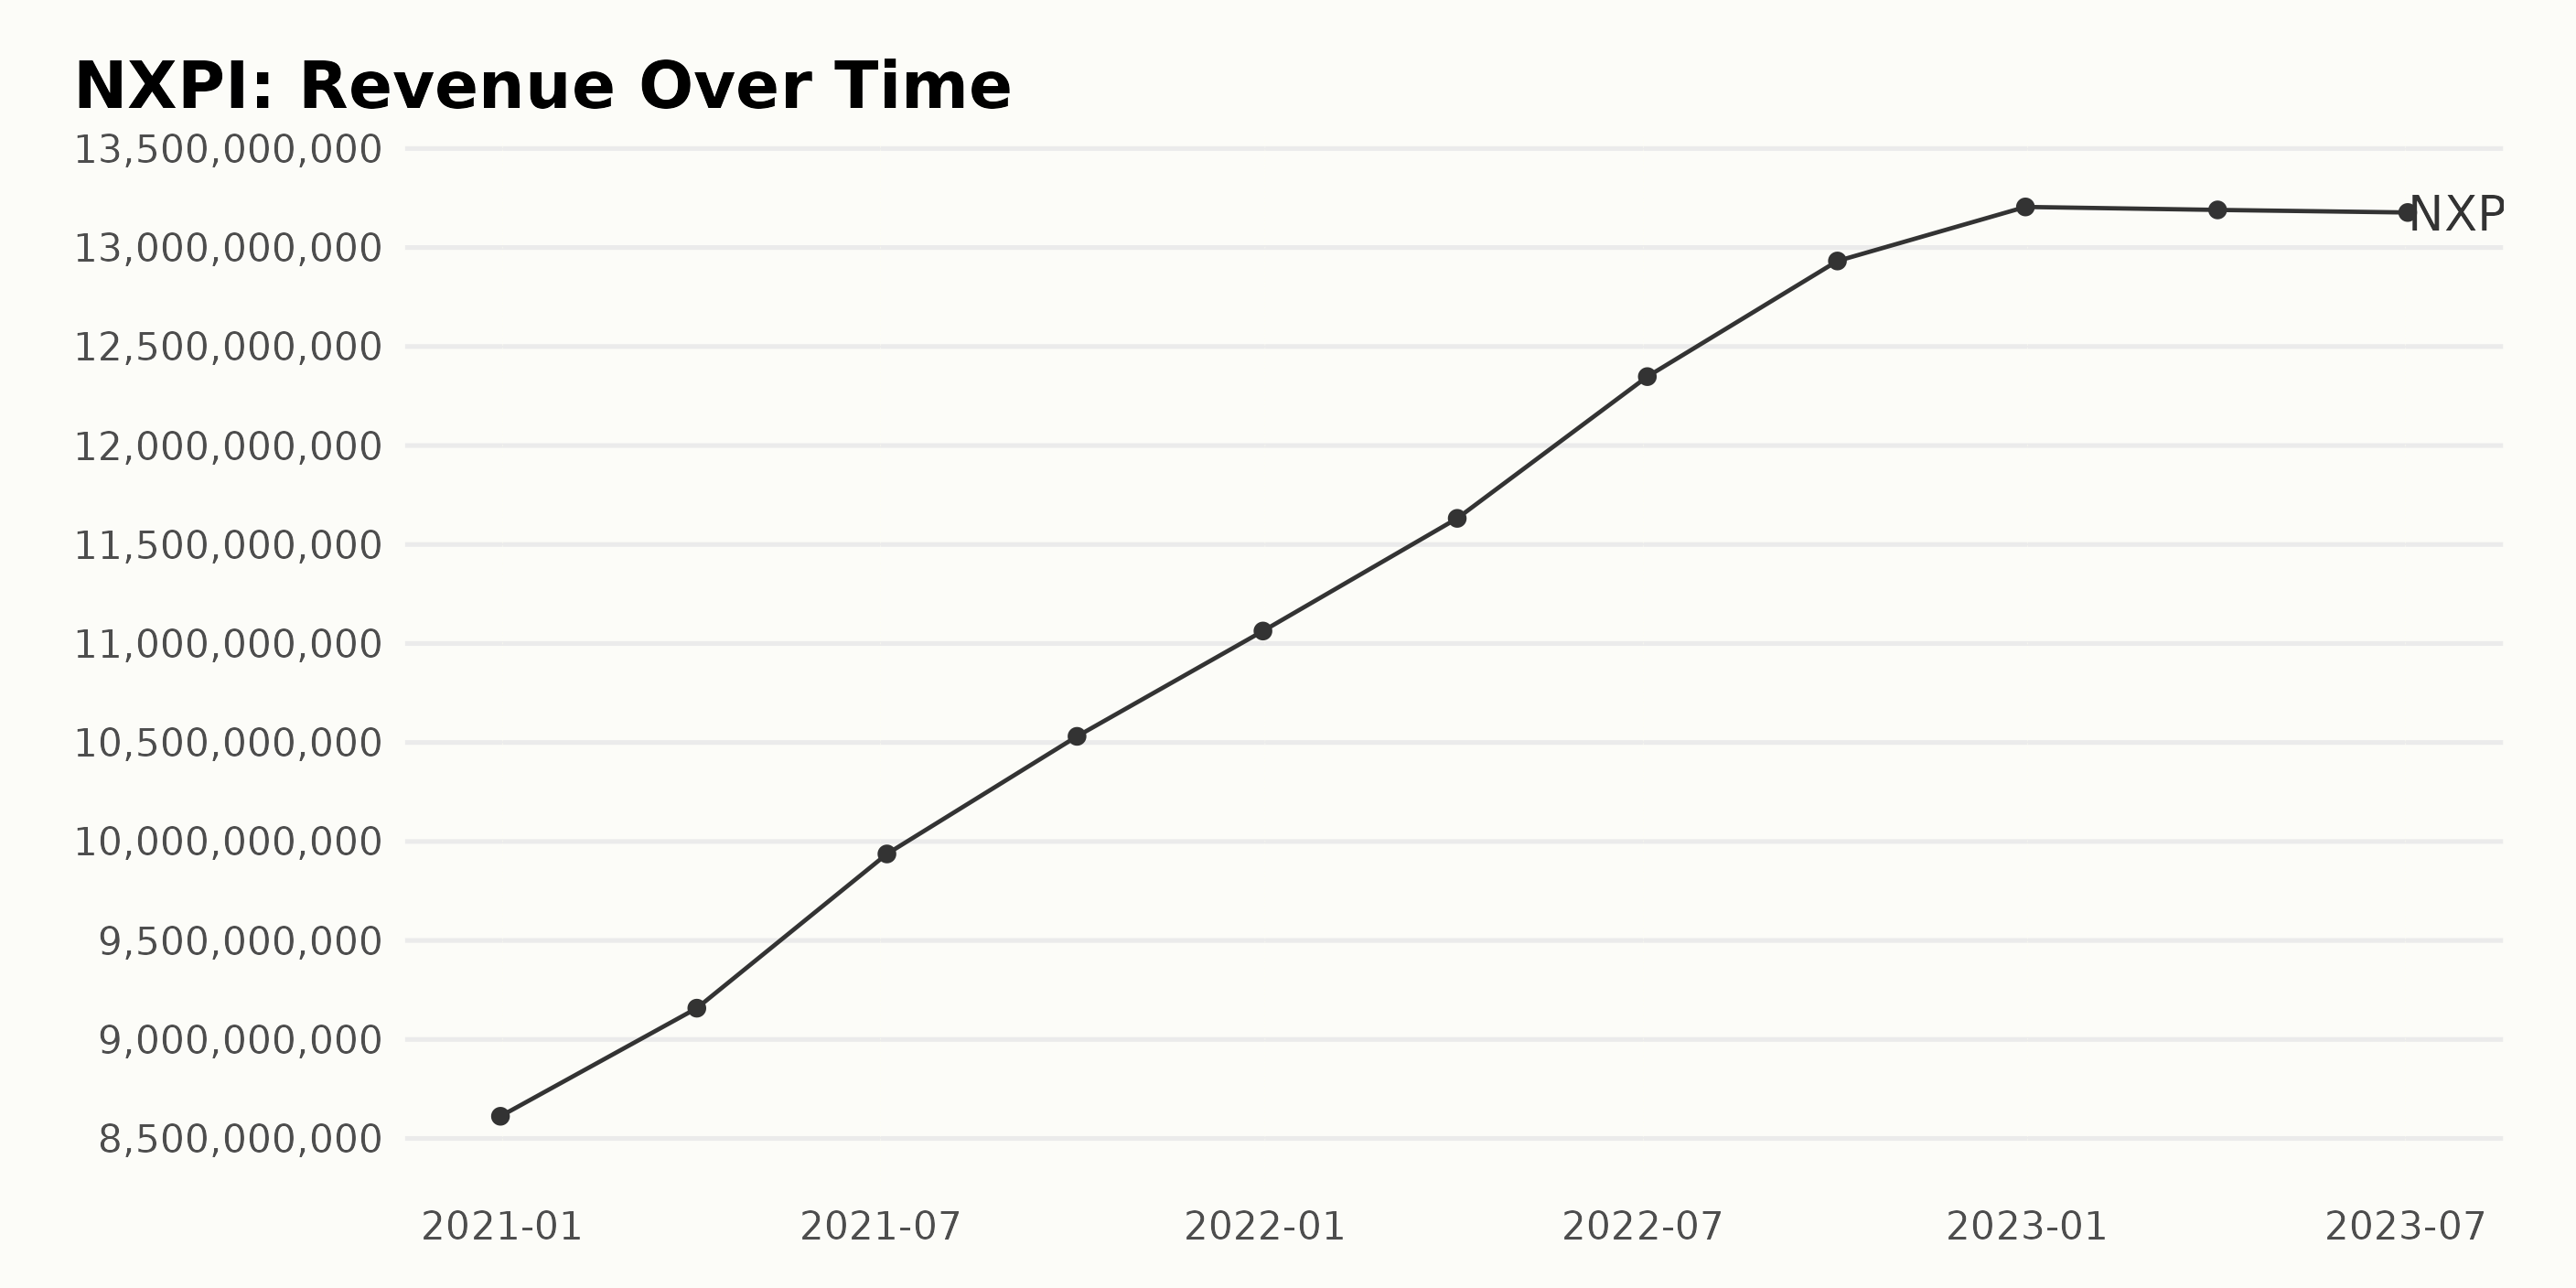
The series of data follows the trend of trailing-12-month revenue reported by NXPI. Examining the numbers, there is a steady increase in revenue from December 2020 to December 2022, followed by slight drops in 2023.
Highlights include:
- At the year-end of 2020, NXPI reported a revenue of $8.61 billion.
- By April 2021, the revenue increased to $9.16 billion, signifying growth from the preceding year.
- After successive quarters of growth, a peak of $13.21 billion was reached in December 2022.
- The first contraction was noticed in April 2023, with a slight decrease to $13.19 billion.
- This downward trend continued till July 2023, when the revenue slightly dropped further to $13.18 billion.
The overall growth rate from December 2020 to July 2023 was significantly high despite the minor dips towards the end of the period. The revenue grew from $8.61 billion to $13.18 billion during this period, leading to a considerable expansion. This suggests a generally positive trend in the company's financial performance, aside from minor recent fluctuations.
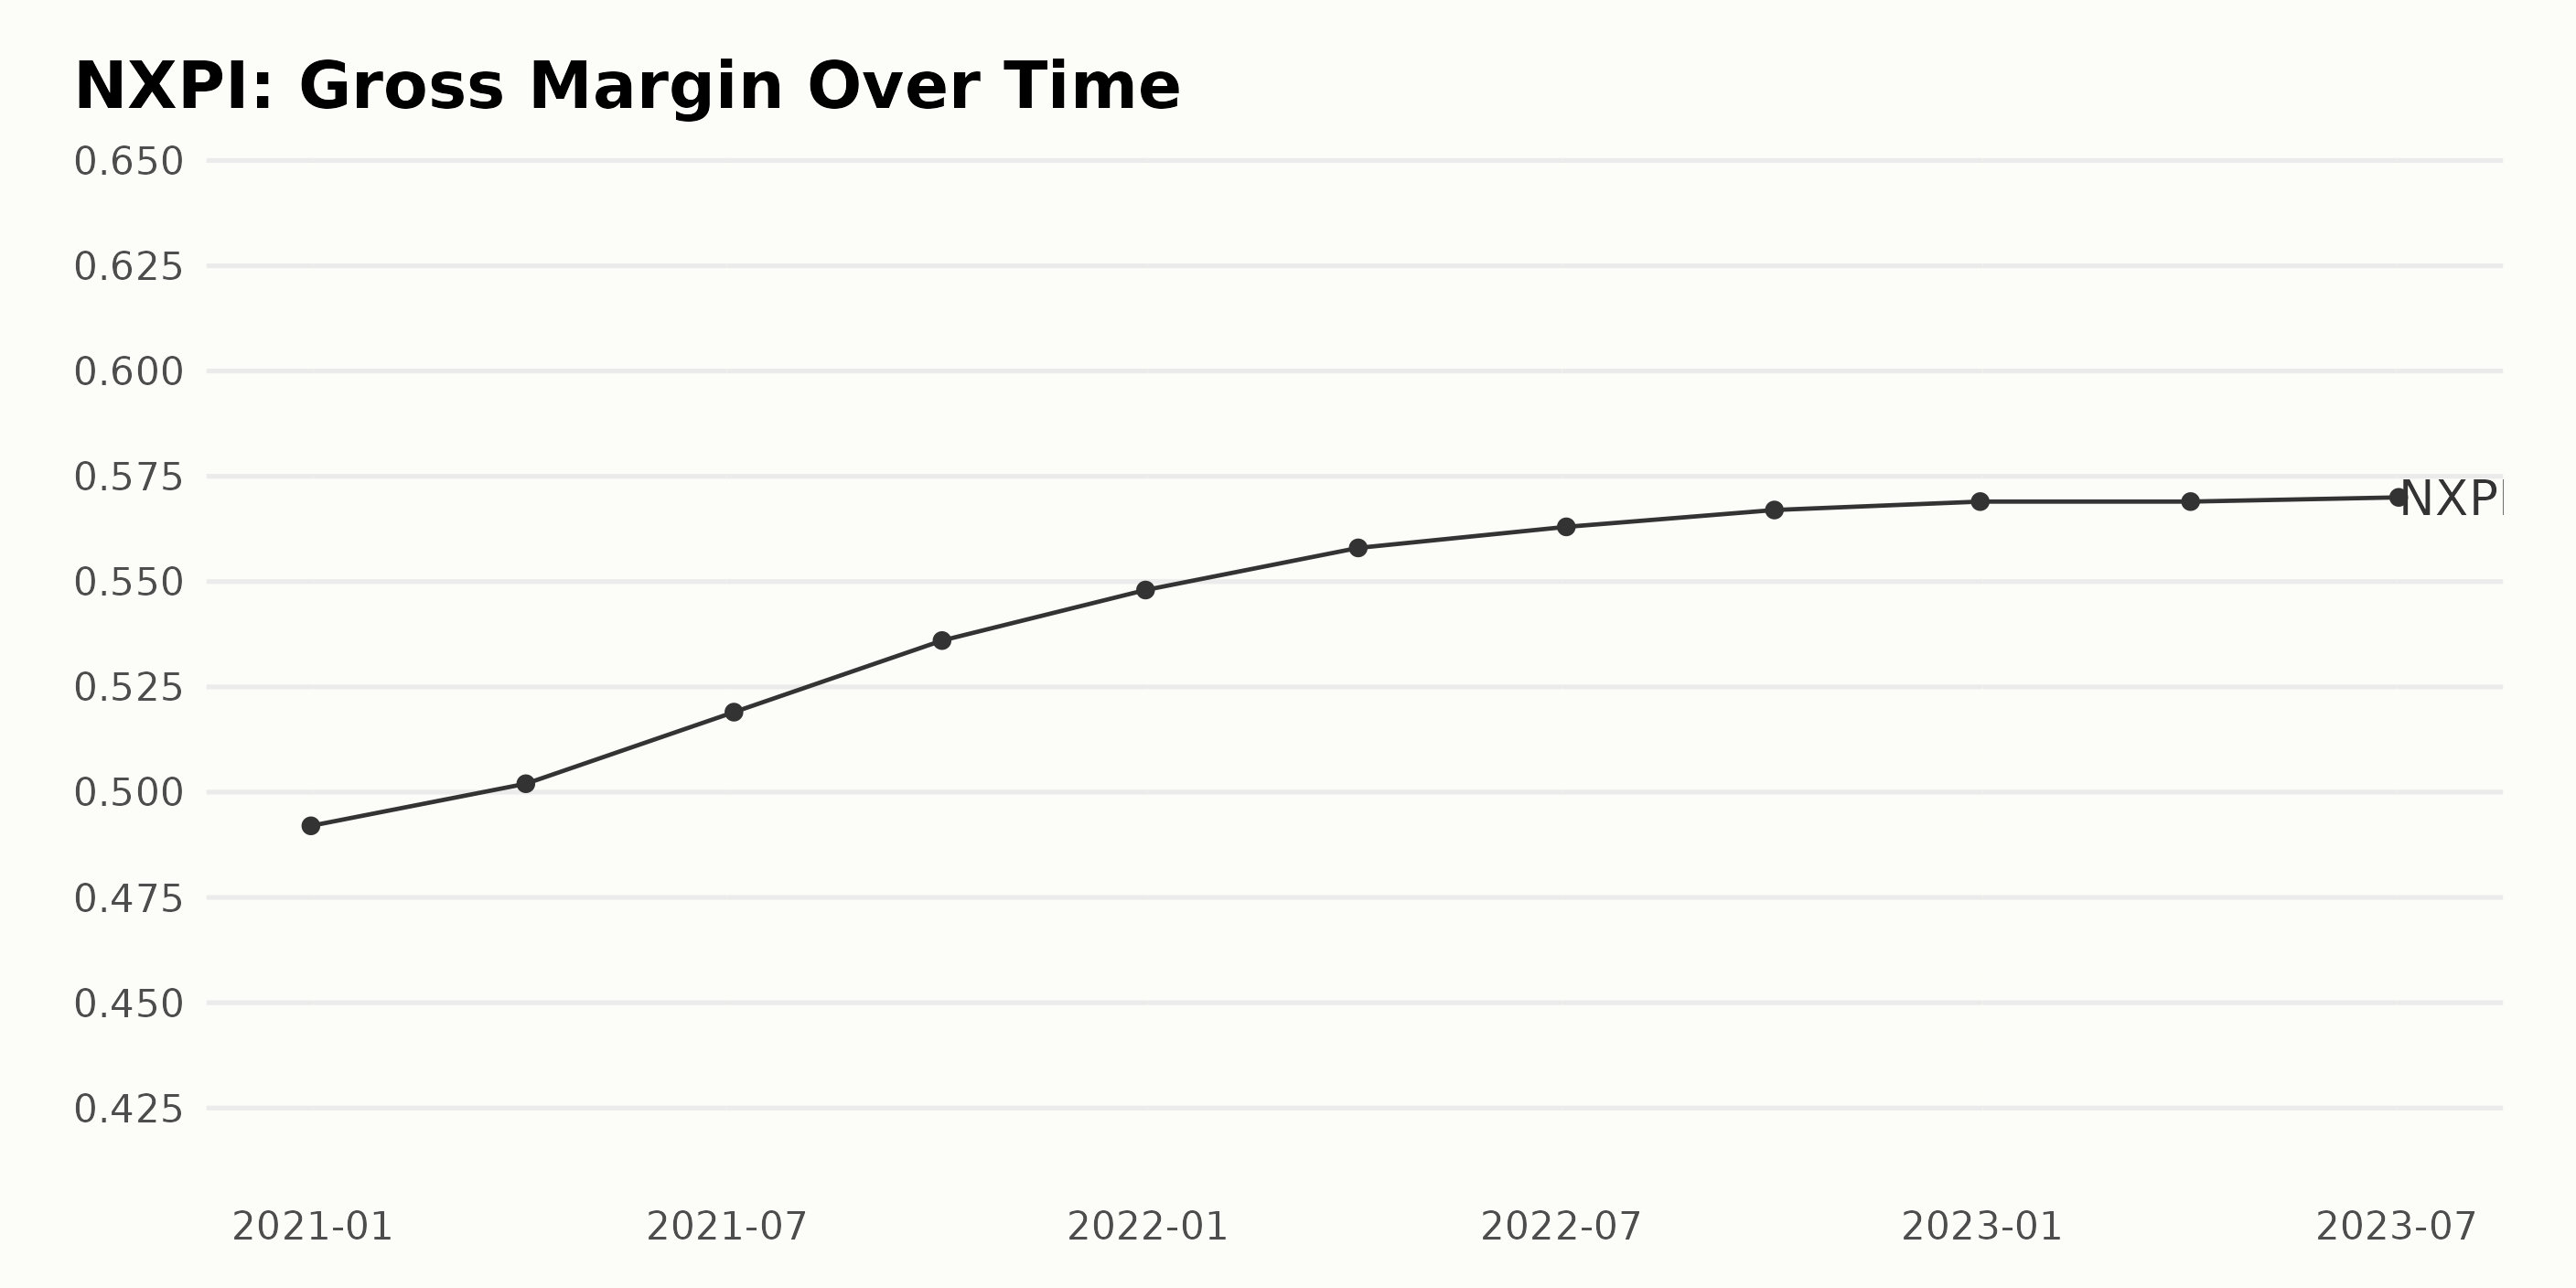
The gross margin for NXPI has exhibited an overall steady upward trend over the past few years, marked by gentle fluctuations.
- On December 31, 2020, the gross margin was at 49.2%.
- There was a slight increment to reach 50.2% by April 4, 2021.
- The trend continued with a rise to 51.9% on July 4, 2021, and further increased to 53.6% by October 3, 2021.
- By the end of 2021, the gross margin had risen to 54.8%.
In 2022, an ongoing upward pattern was observed:
- The gross margin reached 55.8% by April 3rd and then 56.3% by July 3.
- Later that year, it slightly rose to 56.7% on October 2 before settling at 56.9% on December 31.
Data for the first part of 2023 show a slow-grind situation where little growth is observed:
- The gross margin stood at a static 56.9% up until April 2.
- Only a bare 0.1% increment was seen by July 2, bringing the gross margin to 57.0%.
Equating the initial gross margin value from the end of 2020 to the last reported data of mid-2023, NXPI has witnessed an absolute gross margin expansion of 7.8% over these few years. This represents a consistent and considerate growth pattern, increasing from 49.2% to 57.0%.
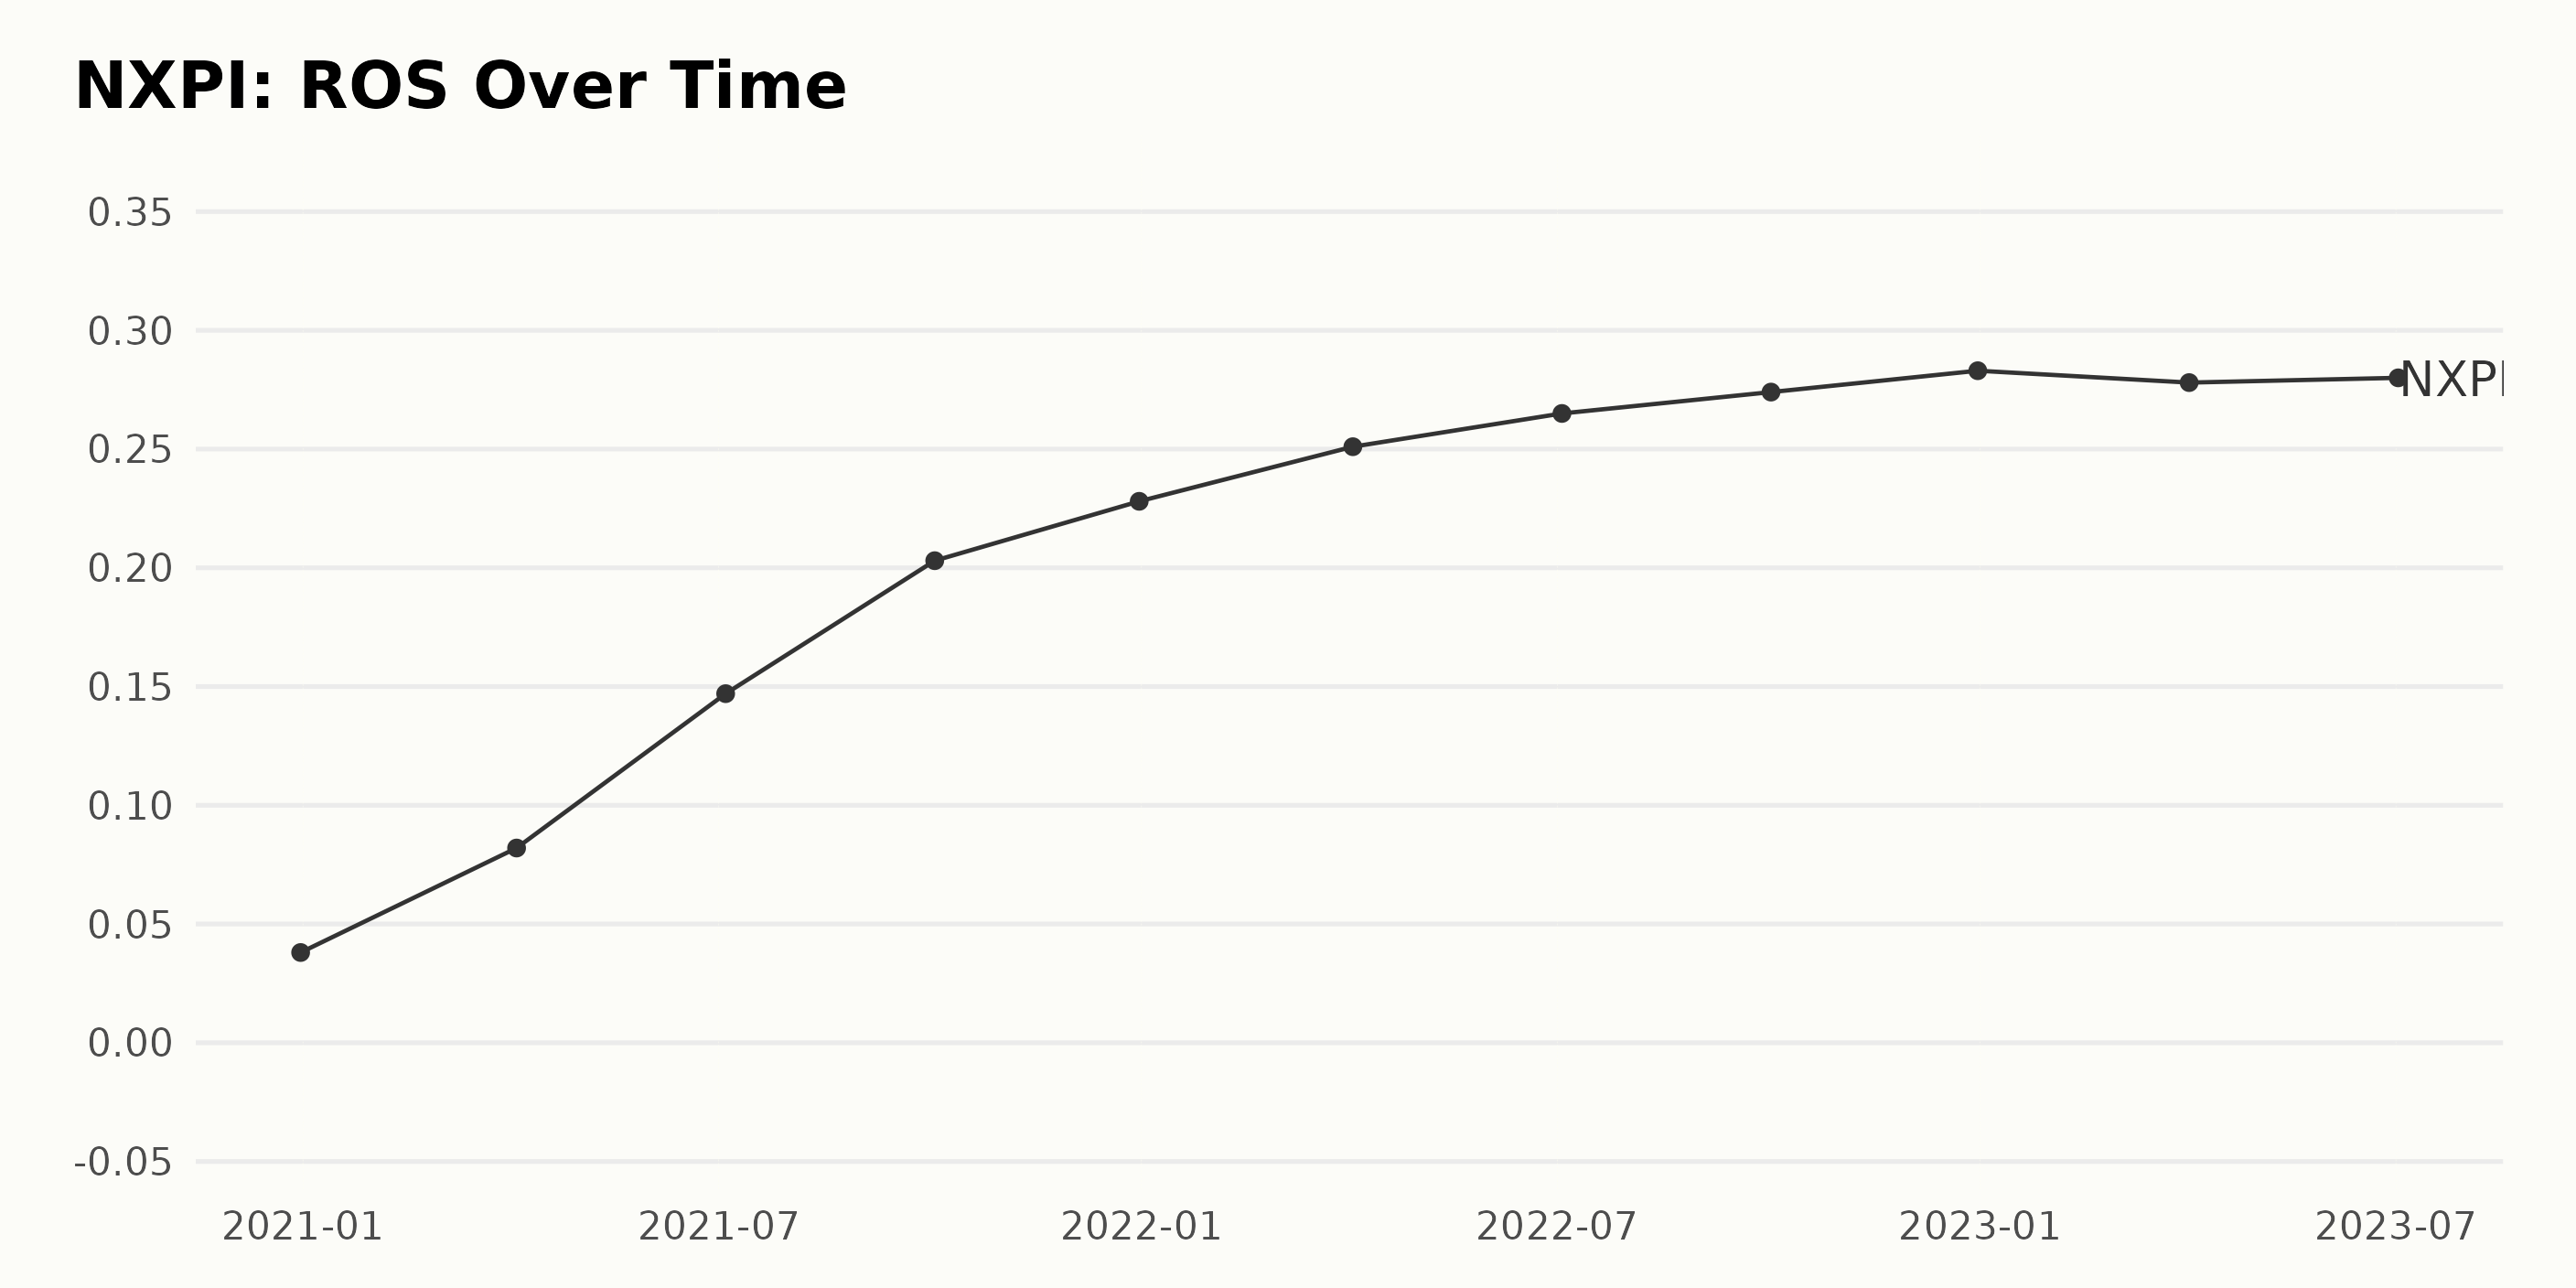
The trend and fluctuations in the Return On Sales (ROS) data for NXPI are summarized as follows:
- Starting at a low of 3.8% on December 31, 2020, the ROS of NXPI witnessed a consistent upward trend until it reached its peak at 28.3% on December 31, 2022. This denotes a rate of increase of approximately 646% over these two years.
- There were fluctuations throughout this period with varying rates of growth. The most notable growth was between April 4, 2021 (8.2% ROS) and July 4, 2021 (14.7% ROS), implying a nearly 79% increase within three months.
- The growth rate, albeit positive, started to slow down in 2022. For instance, the quarter-on-quarter increase was a mere 3.6% between July 3, 2022 (26.5% ROS) and October 2, 2022 (27.4% ROS).
- A reversal in the trend was noticed in 2023 when ROS decreased slightly from 28.3% (December 31, 2022) to 27.8% on April 2, 2023. However, by July 2, 2023, the ROS had recovered marginally to 28%.
Therefore, the more recent data and the last value suggest that the overall growth trend of the ROS for NXPI might be plateauing, and the rate of growth seen over the past years may not continue at the same intensity in future periods.
Examining the Ups and Downs of NXPI Share Prices from May to November 2023
The following are the trends and growth rate of the share prices of NXPI:
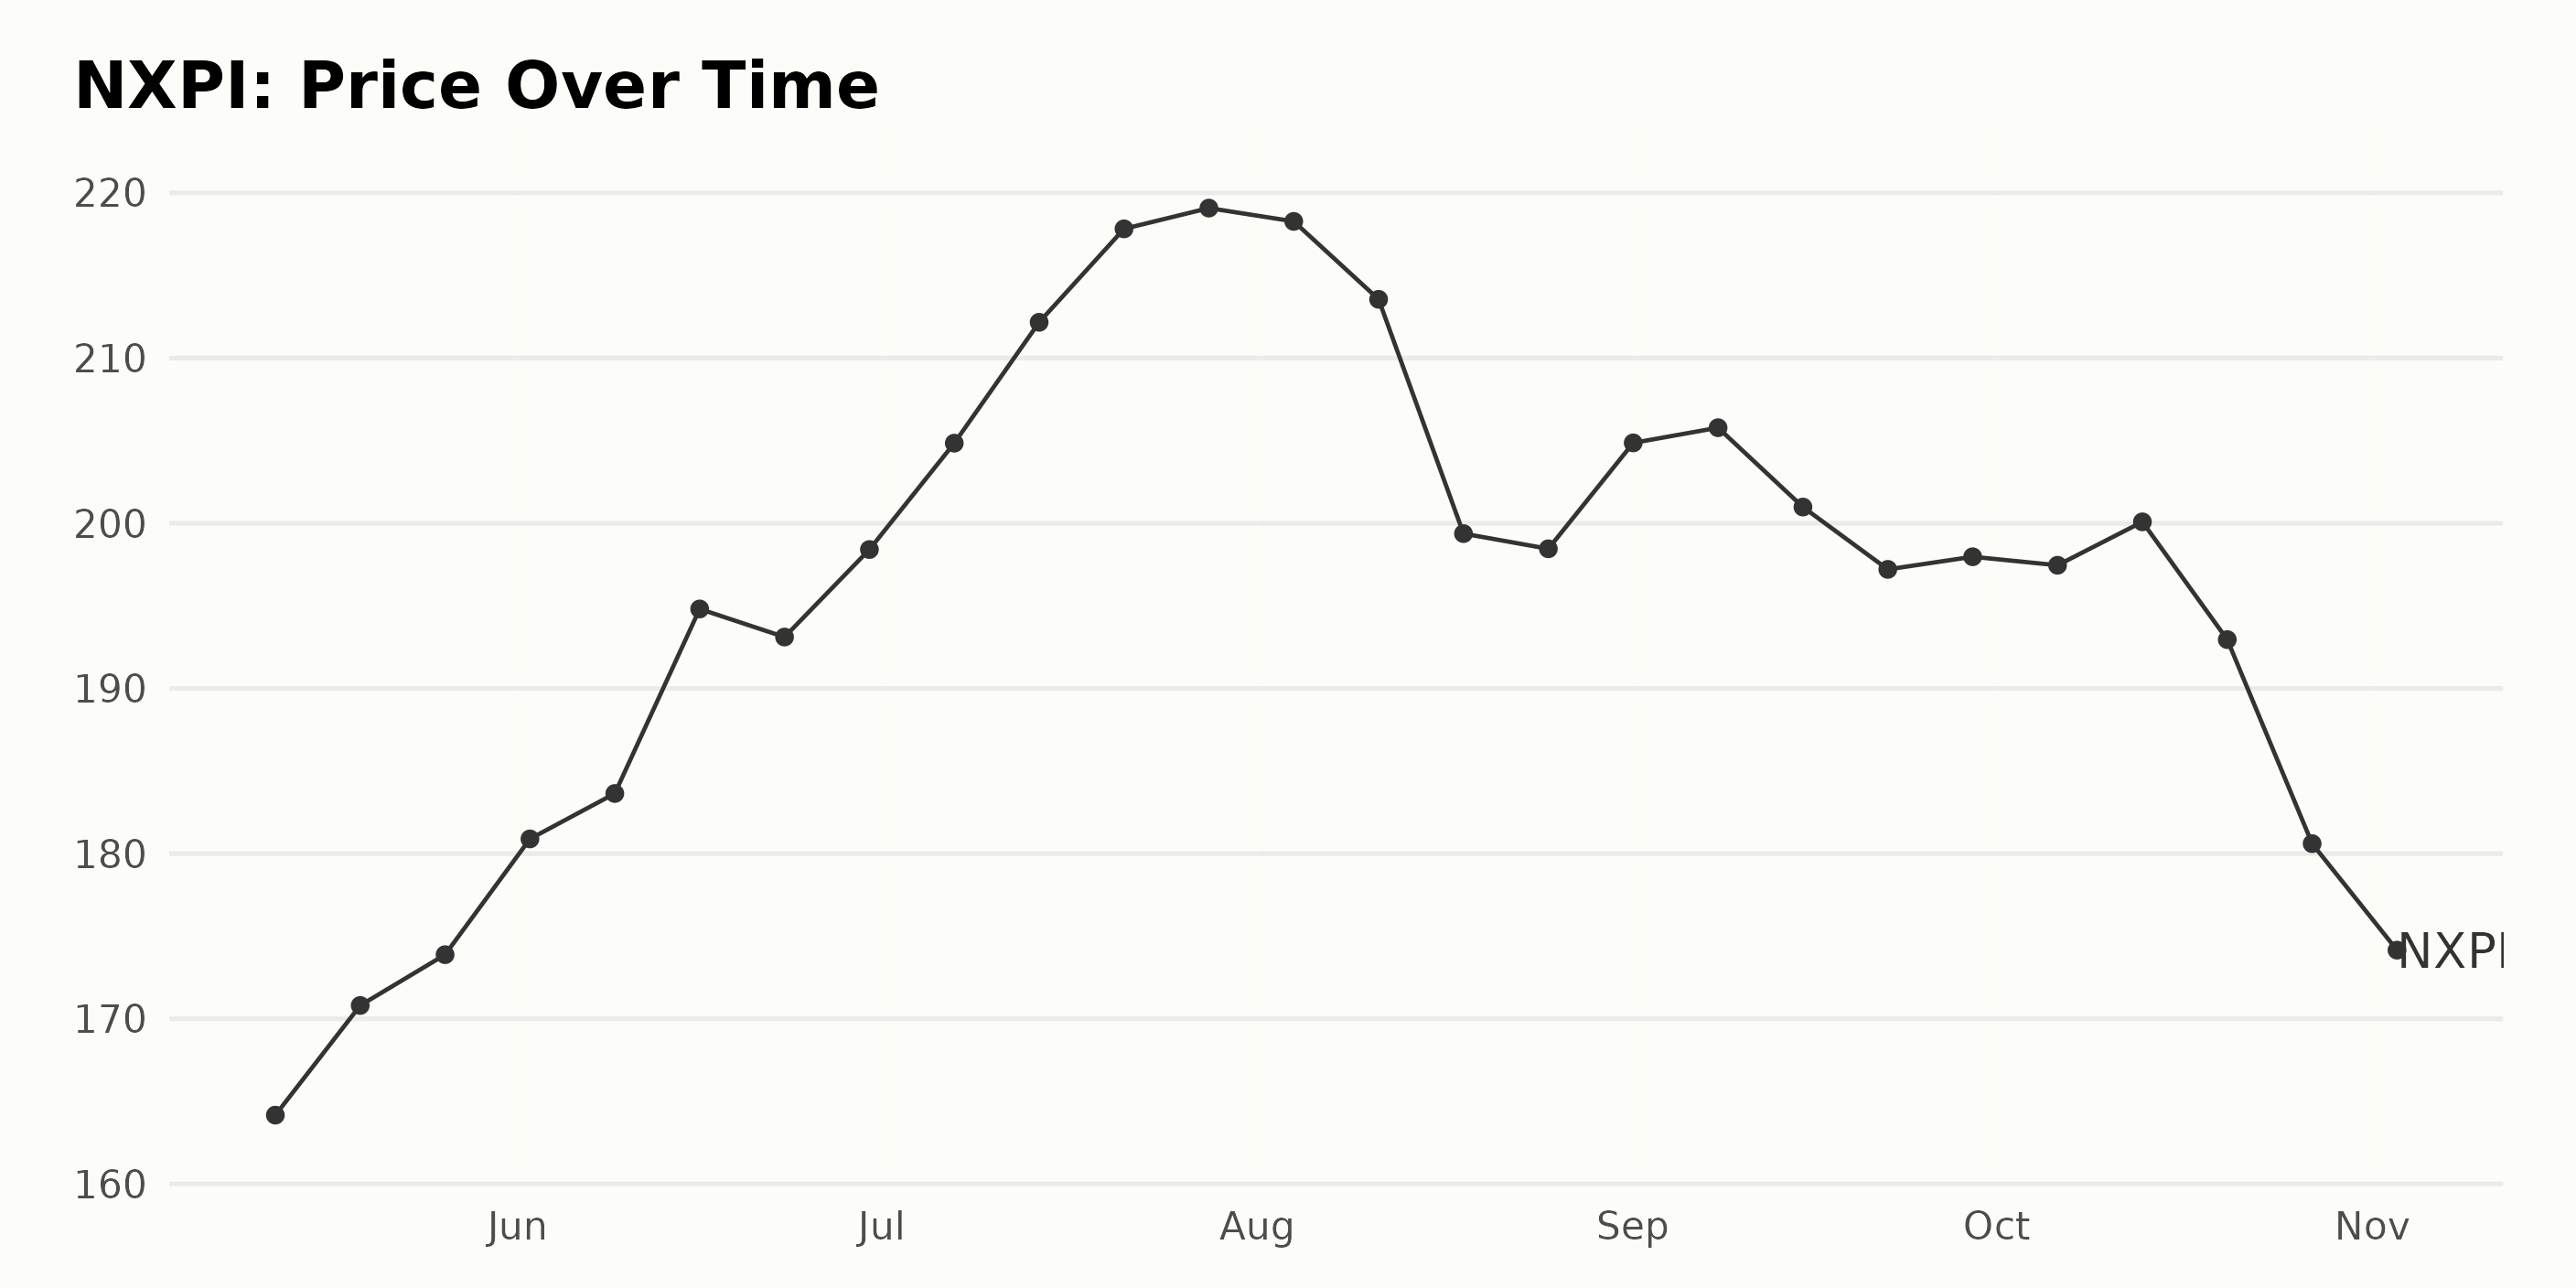
- On May 12, 2023, the price stood at $164.17.
- The significant growth occurred from May to June 2023. The price rose from $170.81 on May 19 to $194.81 on June 16. That's an overall increase of over $24 in a month.
- A peak was reached on July 28, 2023, when the price touched $219.08.
- However, starting from August 11, 2023, we see a clear decelerating trend. In about two weeks, the price dropped by almost $20, reaching a value of $199.37 on August 18, 2023, which is quite noteworthy.
- This downward trend continued through September with minor fluctuations, falling to $197.21 on September 22, 2023, and then slightly picking up again to $200.09 on October 13, 2023.
- The sharpest fall appears in the last period, October 20 to November 3, 2023. The price plummeted from $192.96 to $181.55. This suggests a significant deceleration in the value of NXPI shares.
In conclusion, the prices of NXPI shares showed steady growth from May through July 2023, peaking in late July. However, from August onwards, there was a decelerating trend, which became more pronounced towards the end of October to early November 2023. Here is a chart of NXPI's price over the past 180 days.
Analyzing POWR Ratings for NXP Semiconductors: Momentum, Quality, and Value Dimensions
NXPI, a stock in the Semiconductor & Wireless Chip category, has held a steady POWR Ratings grade of B (Buy) from May 13, 2023, all the way through November 4, 2023. The POWR grade indicates its overall appeal and potential. In terms of its rank within the category, which comprises 91 total stocks, NXPI has maintained a relatively strong position over the duration. Here are some key points:
- On May 13, 2023, NXPI was #17 in the category.
- It slipped slightly to #18 the following week and remained there until June 10, when it moved down to #20.
- The stock gradually improved its rank, reaching #16 place by July 29, 2023, and held on to this rank until August 9, 2023.
- NXPI established its best rank yet on August 26, 2023, where it achieved #12 place in the Semiconductor & Wireless Chip category.
- After some fluctuation, it again secured #12 place by November 6, 2023.
Therefore, while NXPI's POWR grade has maintained stability at B (Buy), its ranking within the Semiconductor & Wireless Chip category has seen moderate fluctuation, albeit within the top quartile of the category.
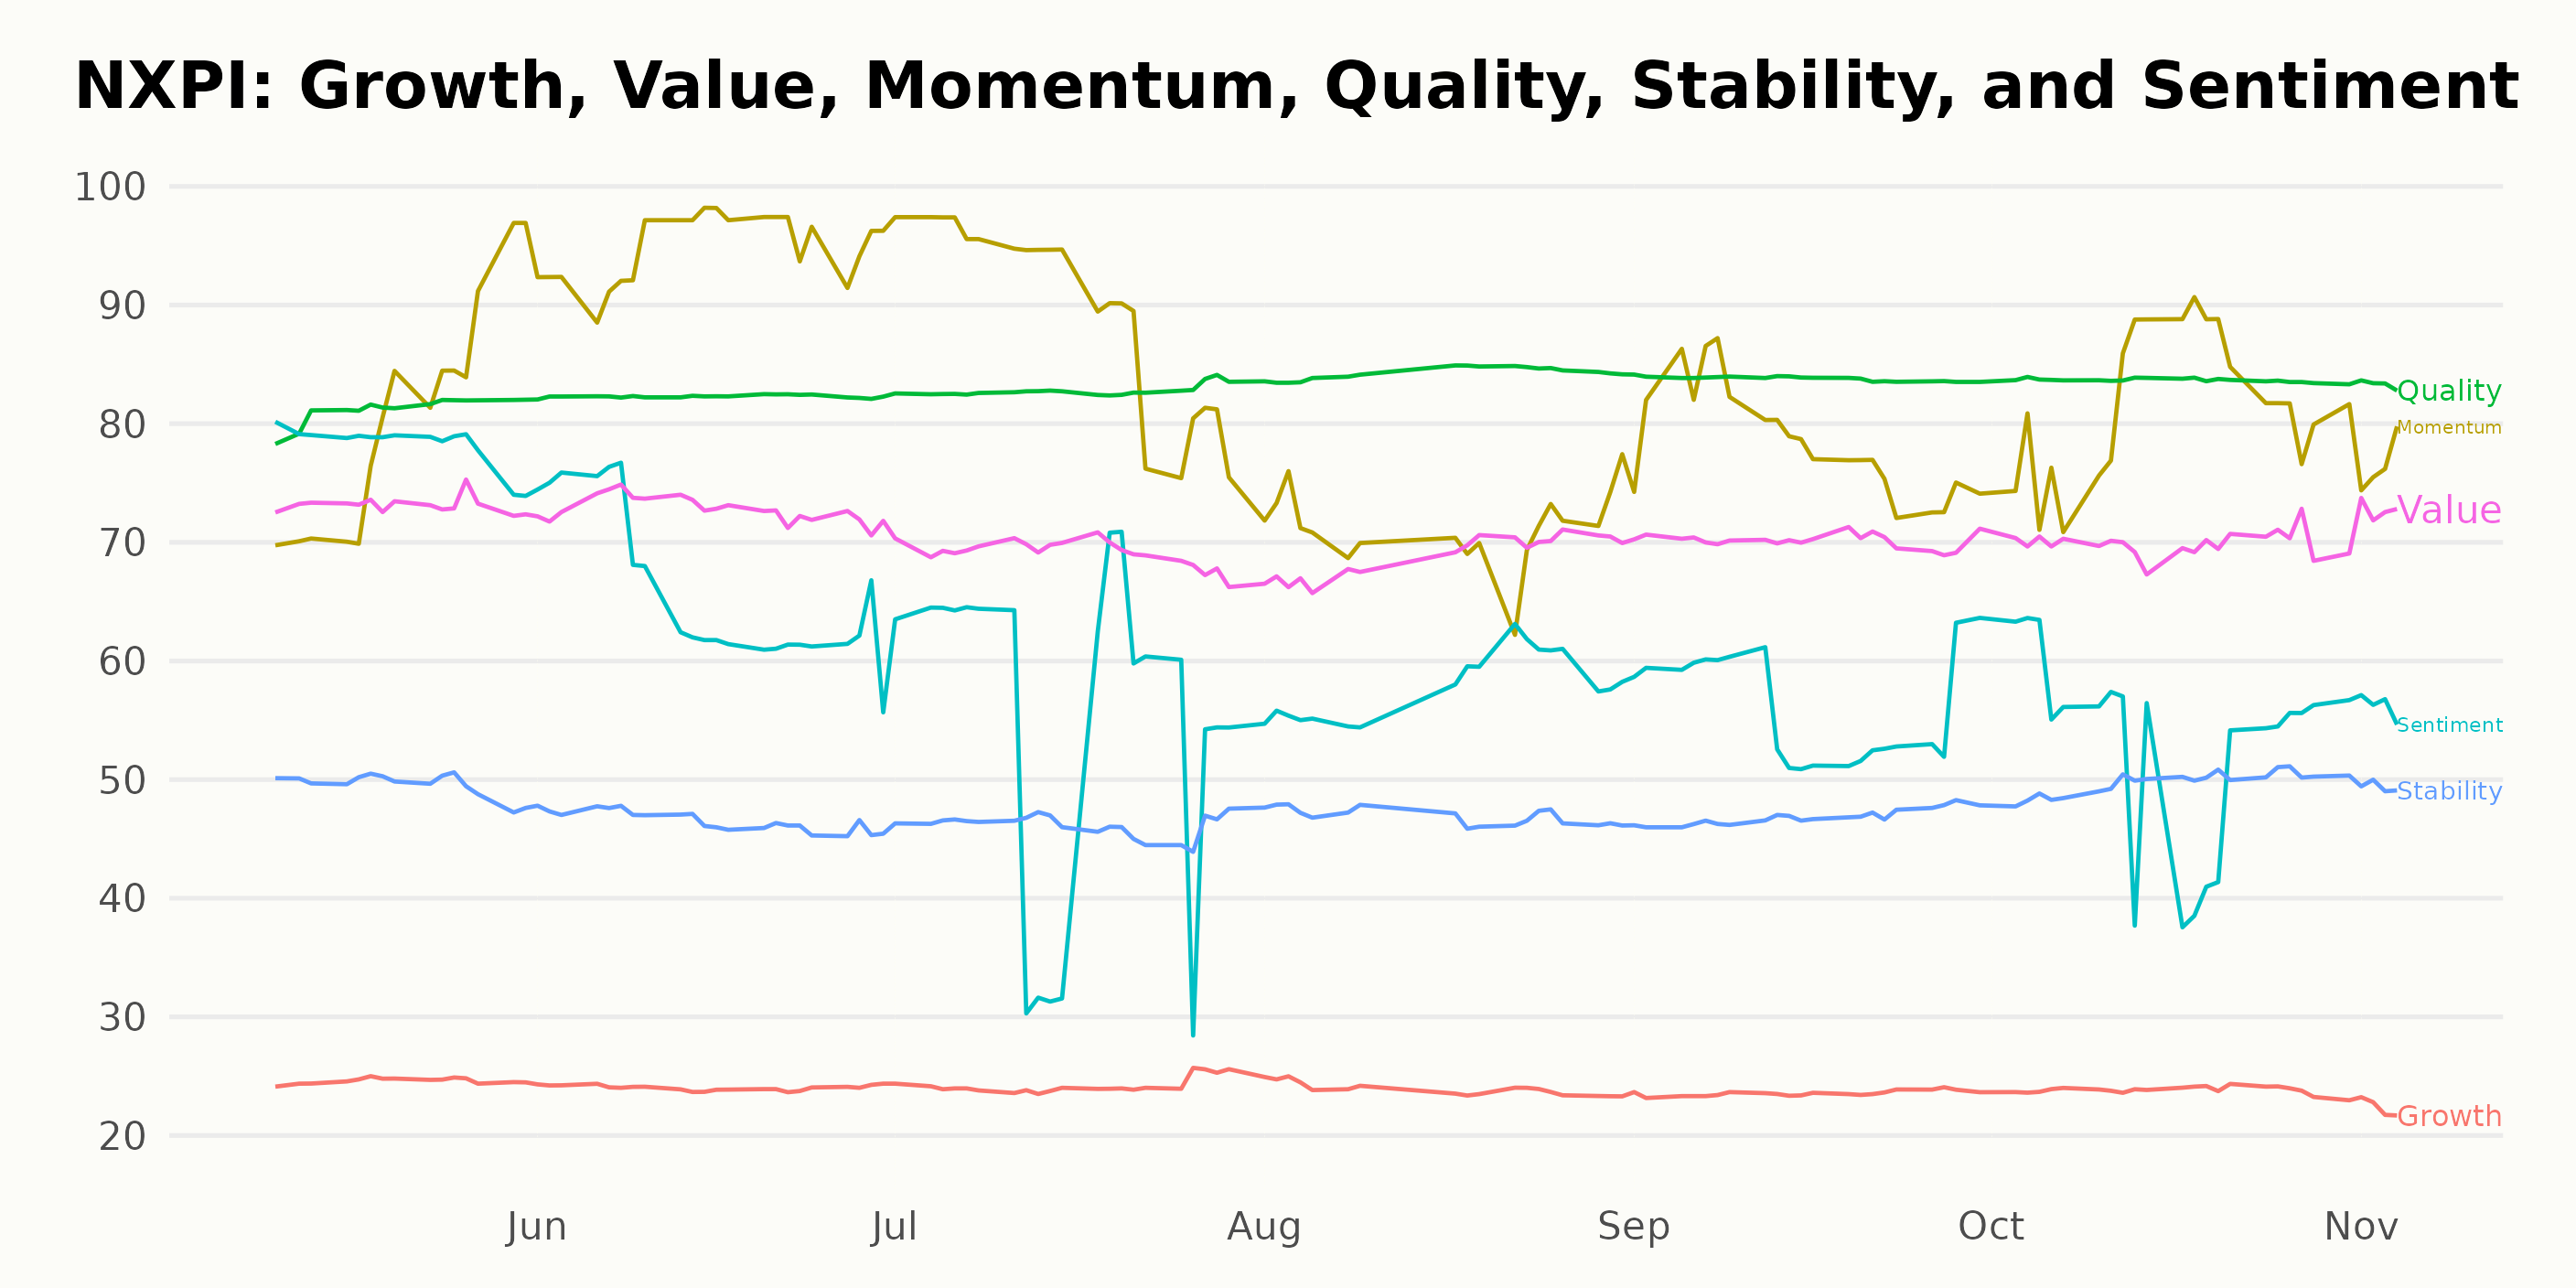
The POWR Ratings for NXPI reveal interesting patterns along the dimensions of Momentum, Quality, and Value. These were selected based on their consistently high ratings relative to the other dimensions.
Momentum - In May 2023, the Momentum rating was 81, making it one of the highest-rated dimensions for NXPI. It saw a significant jump in June 2023, reaching a high point of 95, before gradually dropping through July, August, and September, and then slowly climbing back to 82 by October. Despite its fluctuations, this dimension maintained fairly strong scores throughout these months.
Quality - The Quality dimension also enjoyed a high rating, starting from 81 in May 2023. It showed a gradual but consistent upward trend, increasing slightly each month to peak at 84 by August and maintaining that level through November.
Value - Starting from 73 in May 2023, the Value score maintained a relatively stable rating across the studied months, though it did see a slight decrease by July 2023, down to 69. It slowly increased back up to 70 by September and held steady through October before seeing another rise back to 73 in November.
In conclusion, as measured by the POWR Ratings, the Momentum, Quality and Value dimensions were particularly noteworthy for NXPI during this period, demonstrating either strong scores or clear trends.
How does NXP Semiconductors N.V. (NXPI) Stack Up Against its Peers?
Other stocks in the Semiconductor & Wireless Chip sector that may be worth considering are ChipMOS TECHNOLOGIES INC. (IMOS), Everspin Technologies, Inc. (MRAM), and Renesas Electronics Corporation (RNECF) - they have A (Strong Buy) or B (Buy) overall ratings. Click here to explore more Semiconductor & Wireless Chip stocks.
What To Do Next?
Get your hands on this special report with 3 low priced companies with tremendous upside potential even in today’s volatile markets:
3 Stocks to DOUBLE This Year >
NXPI shares were trading at $183.20 per share on Monday morning, up $1.65 (+0.91%). Year-to-date, NXPI has gained 17.82%, versus a 15.02% rise in the benchmark S&P 500 index during the same period.
About the Author: Anushka Dutta

Anushka is an analyst whose interest in understanding the impact of broader economic changes on financial markets motivated her to pursue a career in investment research.
The post NXP Semiconductors (NXPI) Earnings Anticipation: Buy or Sell? appeared first on StockNews.com