
Recently, Plug Power Inc. (PLUG) posted its second-quarter earnings report, demonstrating a remarkable revenue growth of 72% year-over-year to reach $260.18 million, topping the consensus forecast of $238.45 million. Furthermore, the company reaffirmed its full-year revenue outlook.
The significant increase in revenue was primarily ascribed to expansion with pedestal customers in material handling and considerable growth in cryogenics and liquefaction.
Despite the strong performance on the top line, this growth did not translate into bottom-line improvement. The company registered a net loss of $236.40 million or 40 cents per share in the second quarter, an increase from a loss of $173.30 million or 30 cents per share during the same period last year.
Additionally, the firm reported a negative gross margin of 30% in the quarter, and consistent cash burn continues to pose substantial challenges.
In its shareholder letter, PLUG stated, “the Company has clear short-term goals to improve profitability in the second half of 2023 and position additional cost down initiatives through 2024 as we significantly ramp sales volumes.” Although Plug Power is making significant strides toward profitability, the trajectory remains cloudy.
So, this might not the right time to own PLUG shares. Let’s look at some of its metrics that support my bearish stance on the stock.
An In-Depth Analysis of Plug Power Inc.’s Financial Highlights and Challenges (2020-2023)
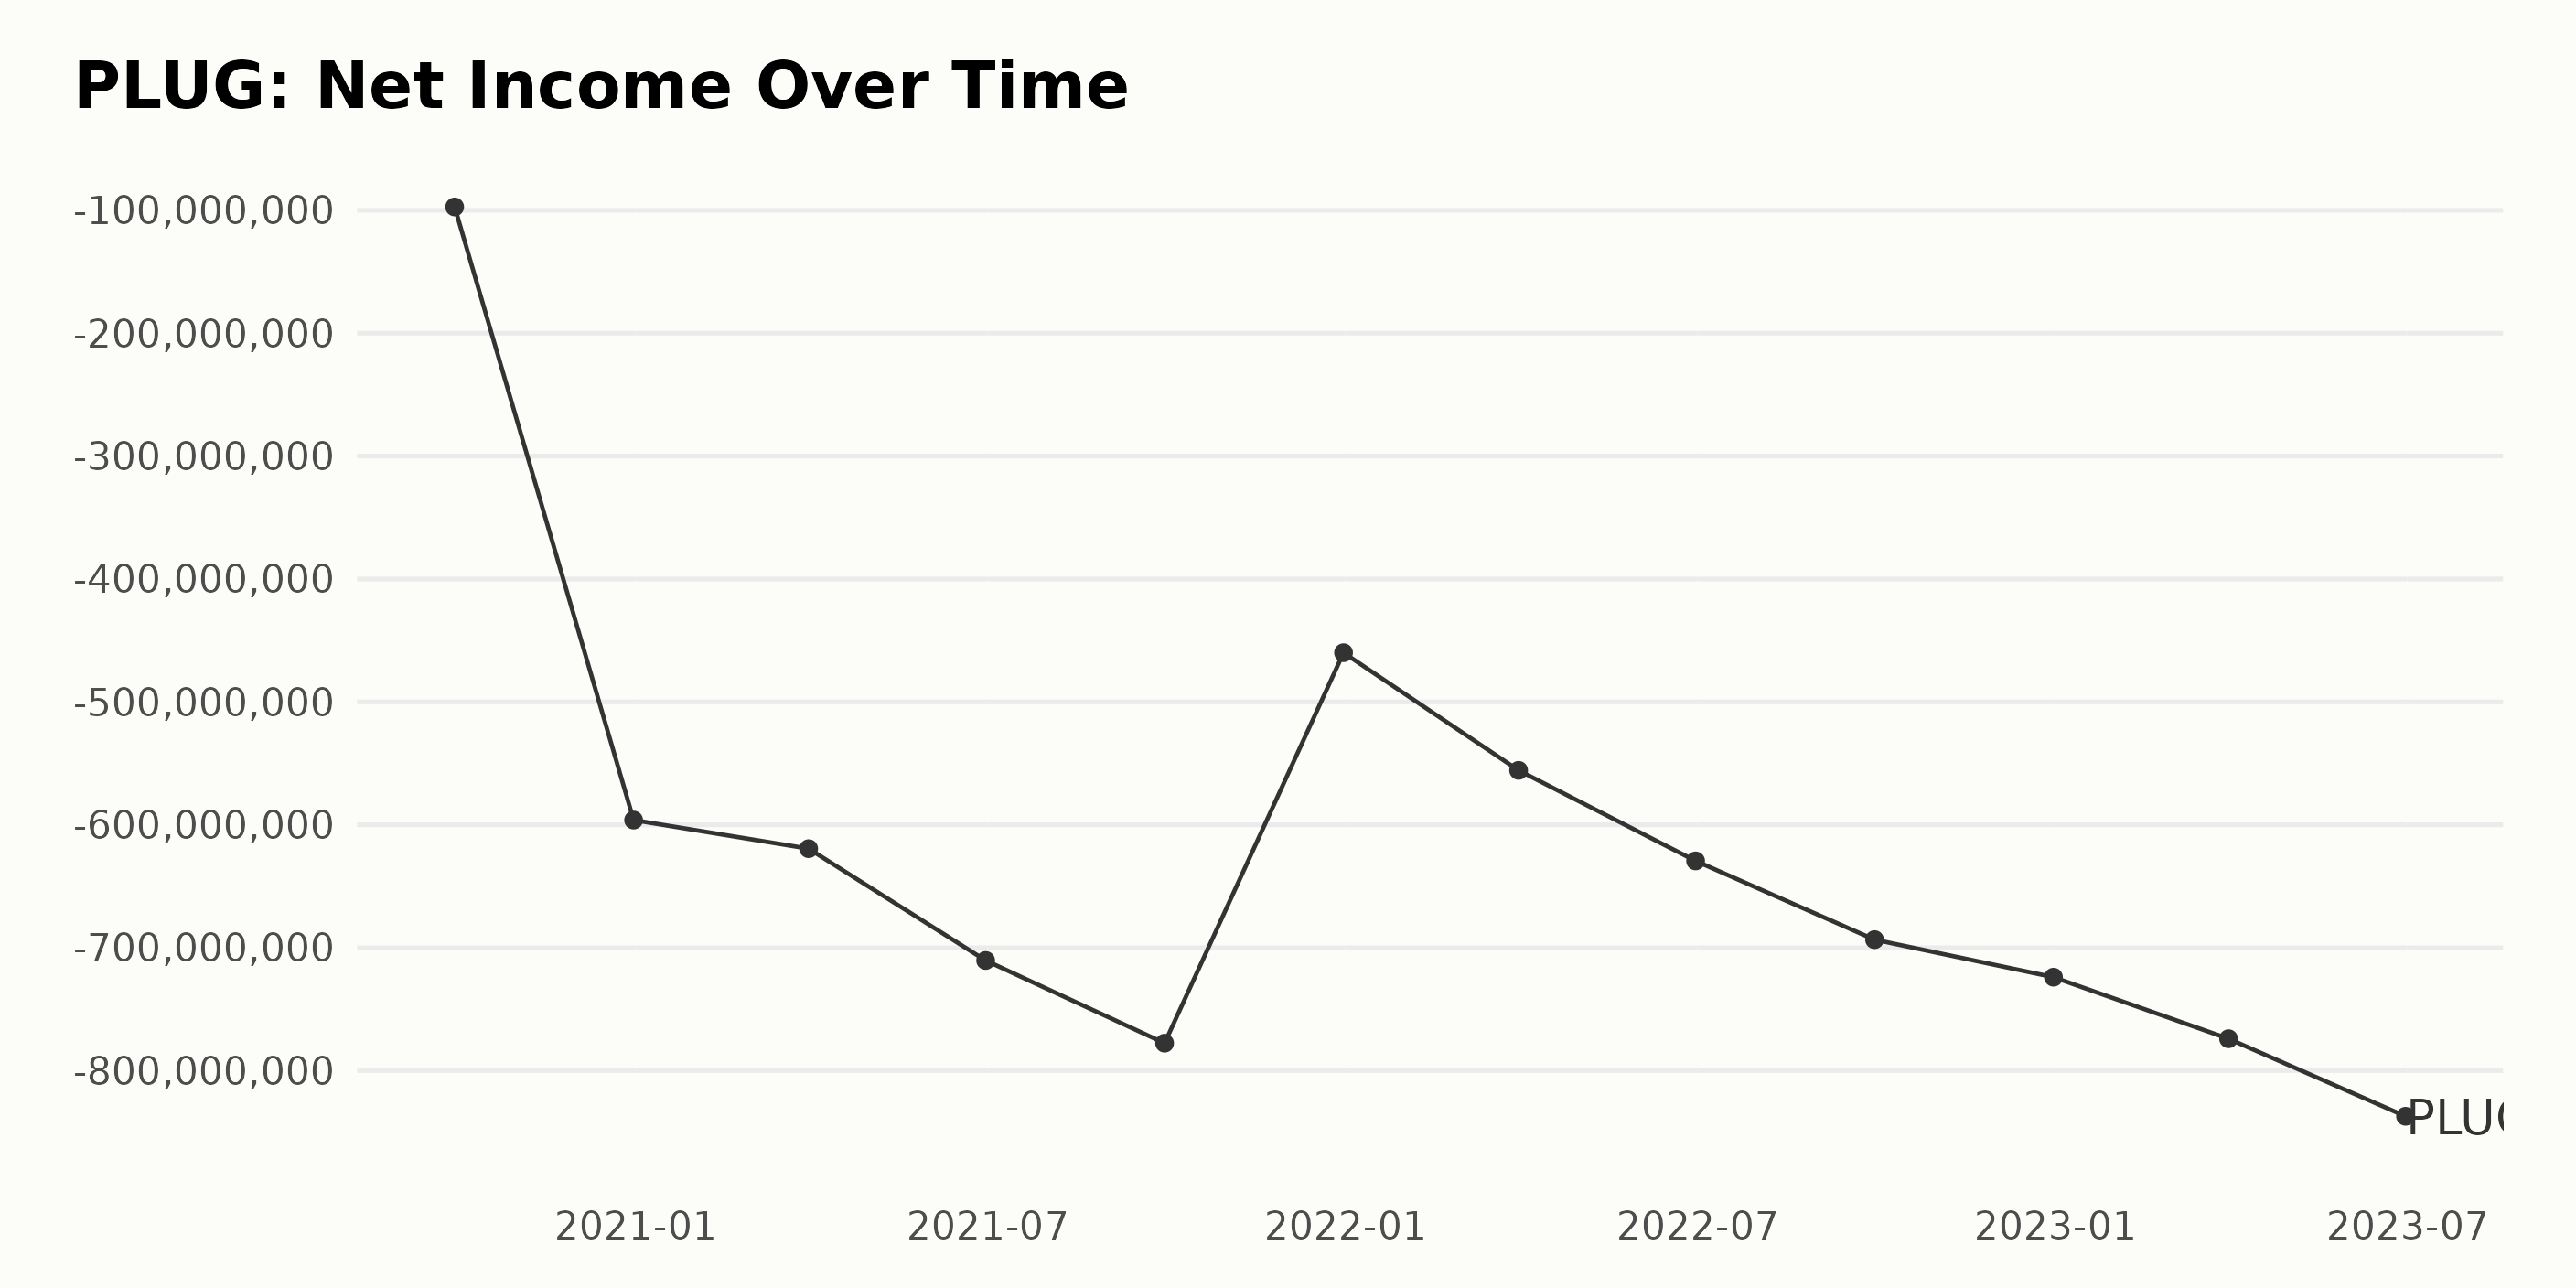
The trailing-12-month net income for PLUG has been predominantly negative over the given period, experiencing a general downward trend with intermittent fluctuations.
- Starting at -$97.25 million in September 2020, the net loss increased to -$596.16 million by December same year.
- In 2021, there was a consistent deepening in net loss from -$619.42 million in March 2021, reaching a high of -$777.69 million in September. However, an improvement was experienced, closing the year with a net income of -$459.97 million in December 2021.
- The year 2022 opened with a negative net income of -$555.71 million in March. The figure continued to rise to -$693.46 million by September. A slight increase was observed by the end of the year, with net income standing at -$724.01 million in December 2022.
- In 2023, the trend persisted, with net loss increasing to -$774.08 million in March and further to -$837.18 million in June 2023.
The overall growth rate, measured from the first value to the last value, demonstrated an escalating deficit.
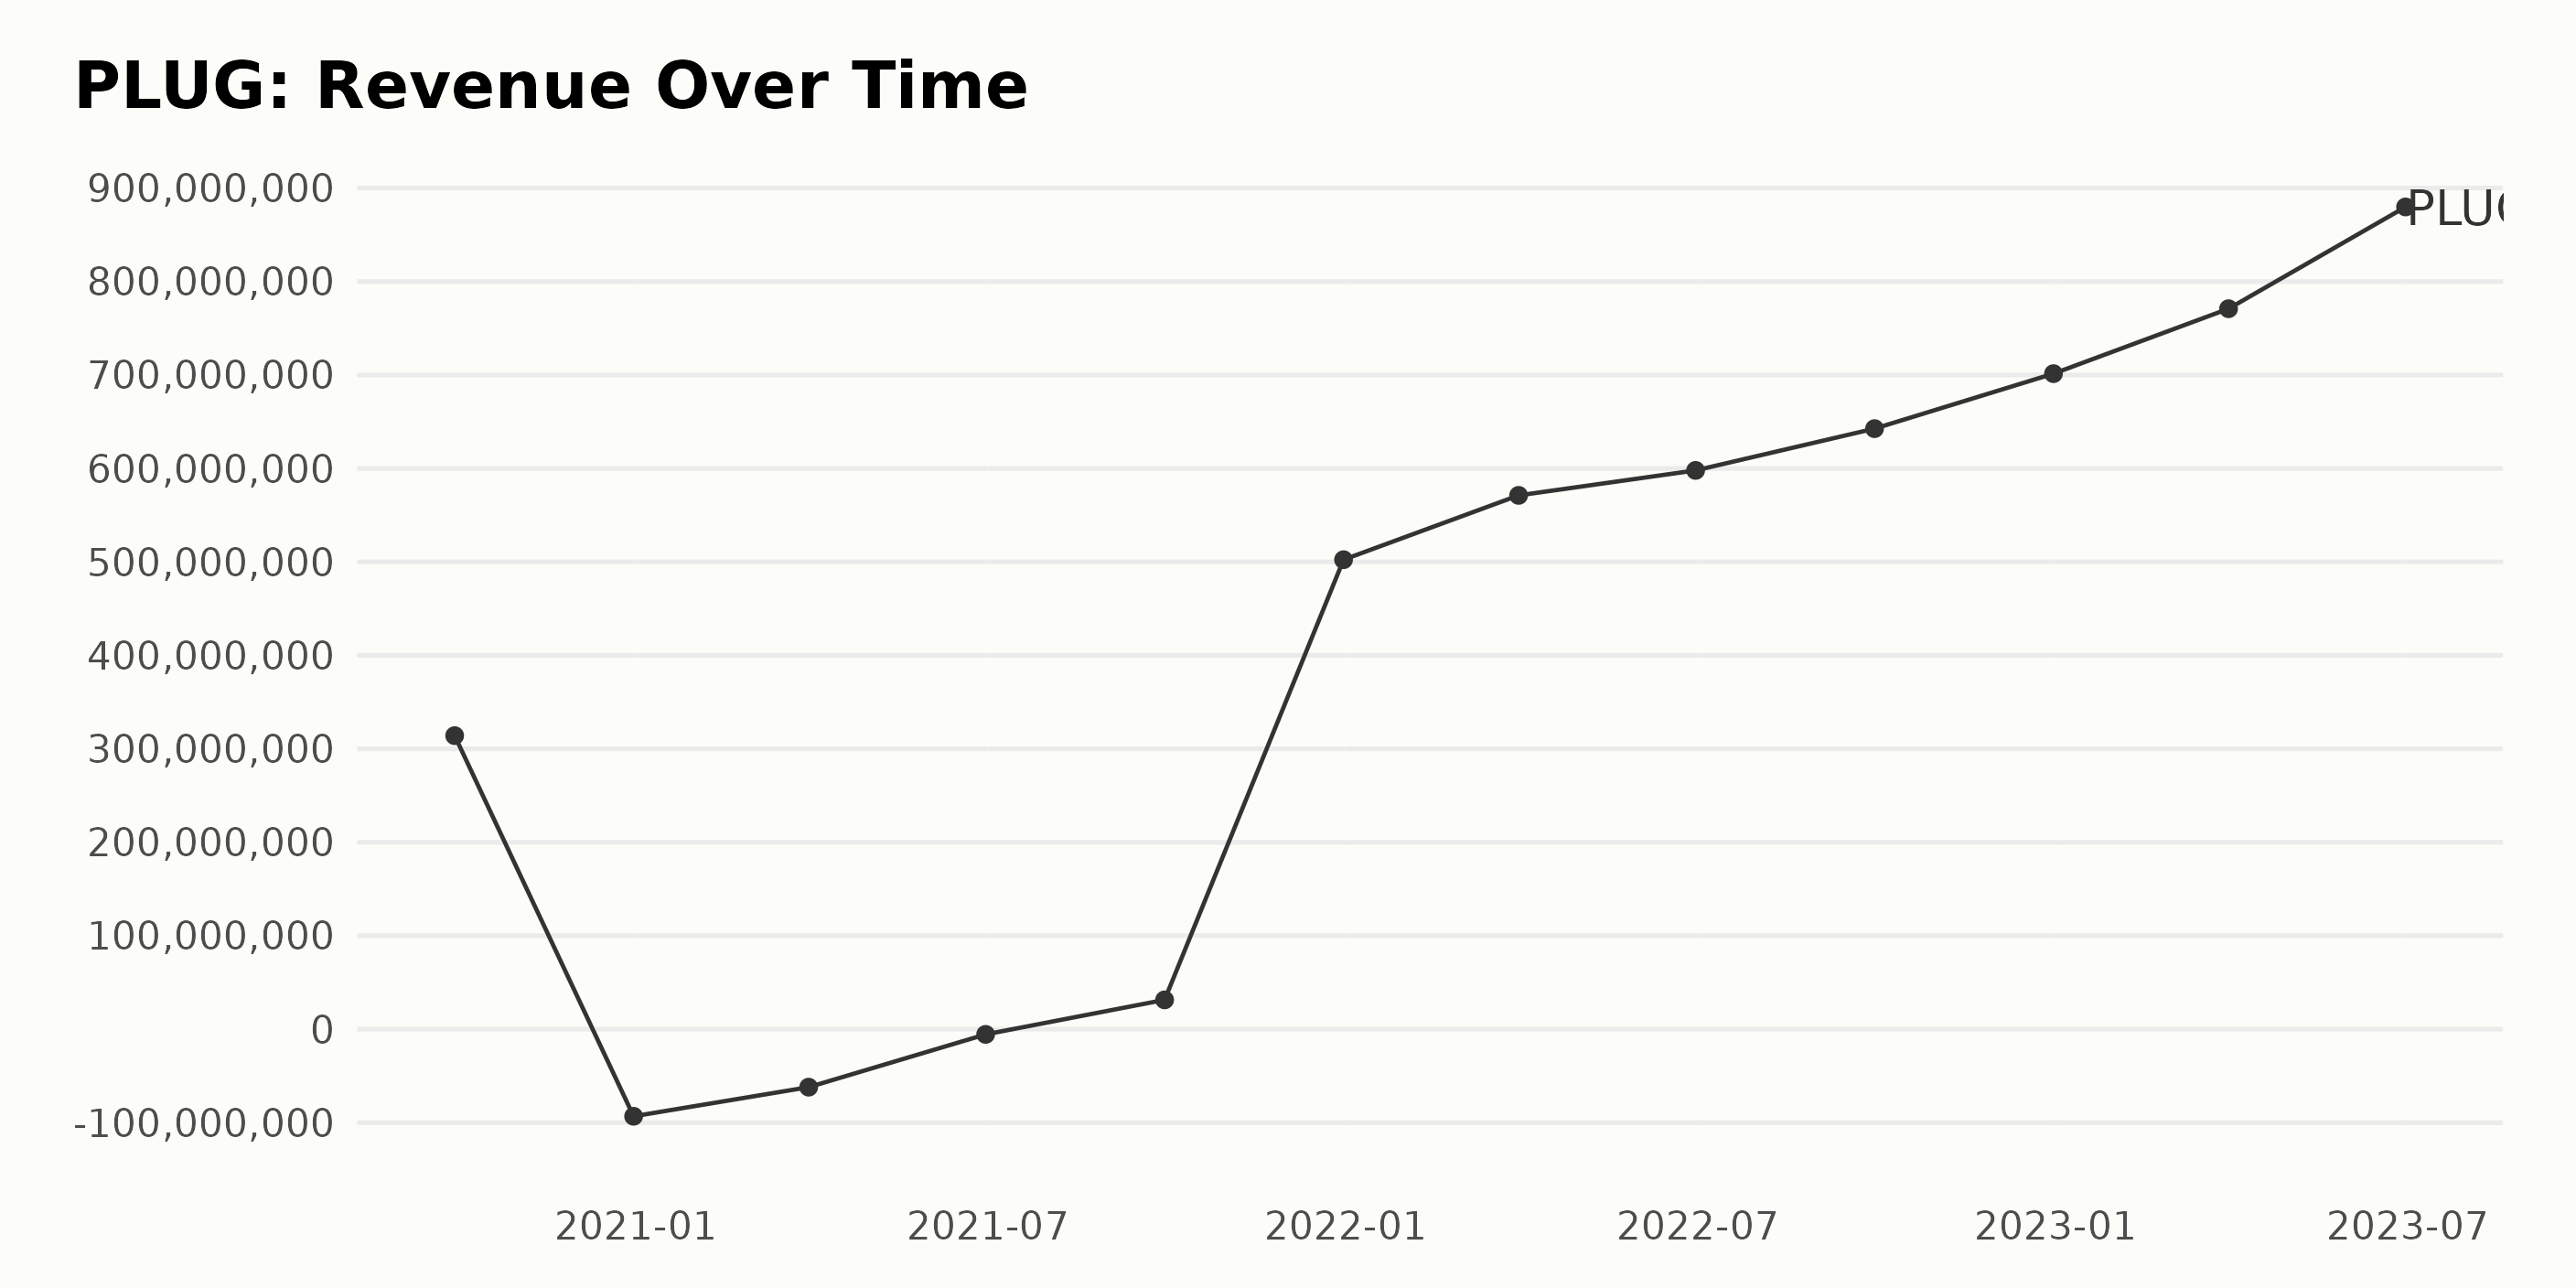
The trailing-12-month revenue trend of PLUG experienced several fluctuations over the past years. Here are the most significant movements:
- As of September 30, 2020, PLUG had a revenue of $314.1 million.
- By the end of 2020, on December 31, the company’s revenue plunged into the negatives, reaching -$93.24 million.
- In the first and second quarters of 2021, it dropped to -$62.09 million and -$5.61 million, respectively, until a notable upward movement, ending the third quarter on September 30, with a positive revenue of $31.33 million.
This upward trend continued to enhance significantly, the revenue jumped to $502.3 million by December 31, 2021, showing a considerable improvement over the -$93.24 million during the same period in 2020. Throughout 2022, the company maintained an impressive growth rate in its revenue:
- $571.2 million on March 31, 2022;
- $597.9 million on June 30, 2022;
- $642.6 million on September 30, 2022;
- Ending the year with $701.44 million as of December 31, 2022.
In 2023, the revenue even improved more:
- The first quarter ended at $770.9 million in March 2023;
- And the last recorded value was $879.8 million on June 30, 2023.
In conclusion, from September 30, 2020, to June 30, 2023, PLUG experienced a notable increase in its revenue from $314.1 million to $879.8 million. This indicates a substantial overall growth rate for the given period. Despite significant fluctuations, mainly in 2020 and 2021, the revenue exemplifies a positive and upward-growing trend in later years.
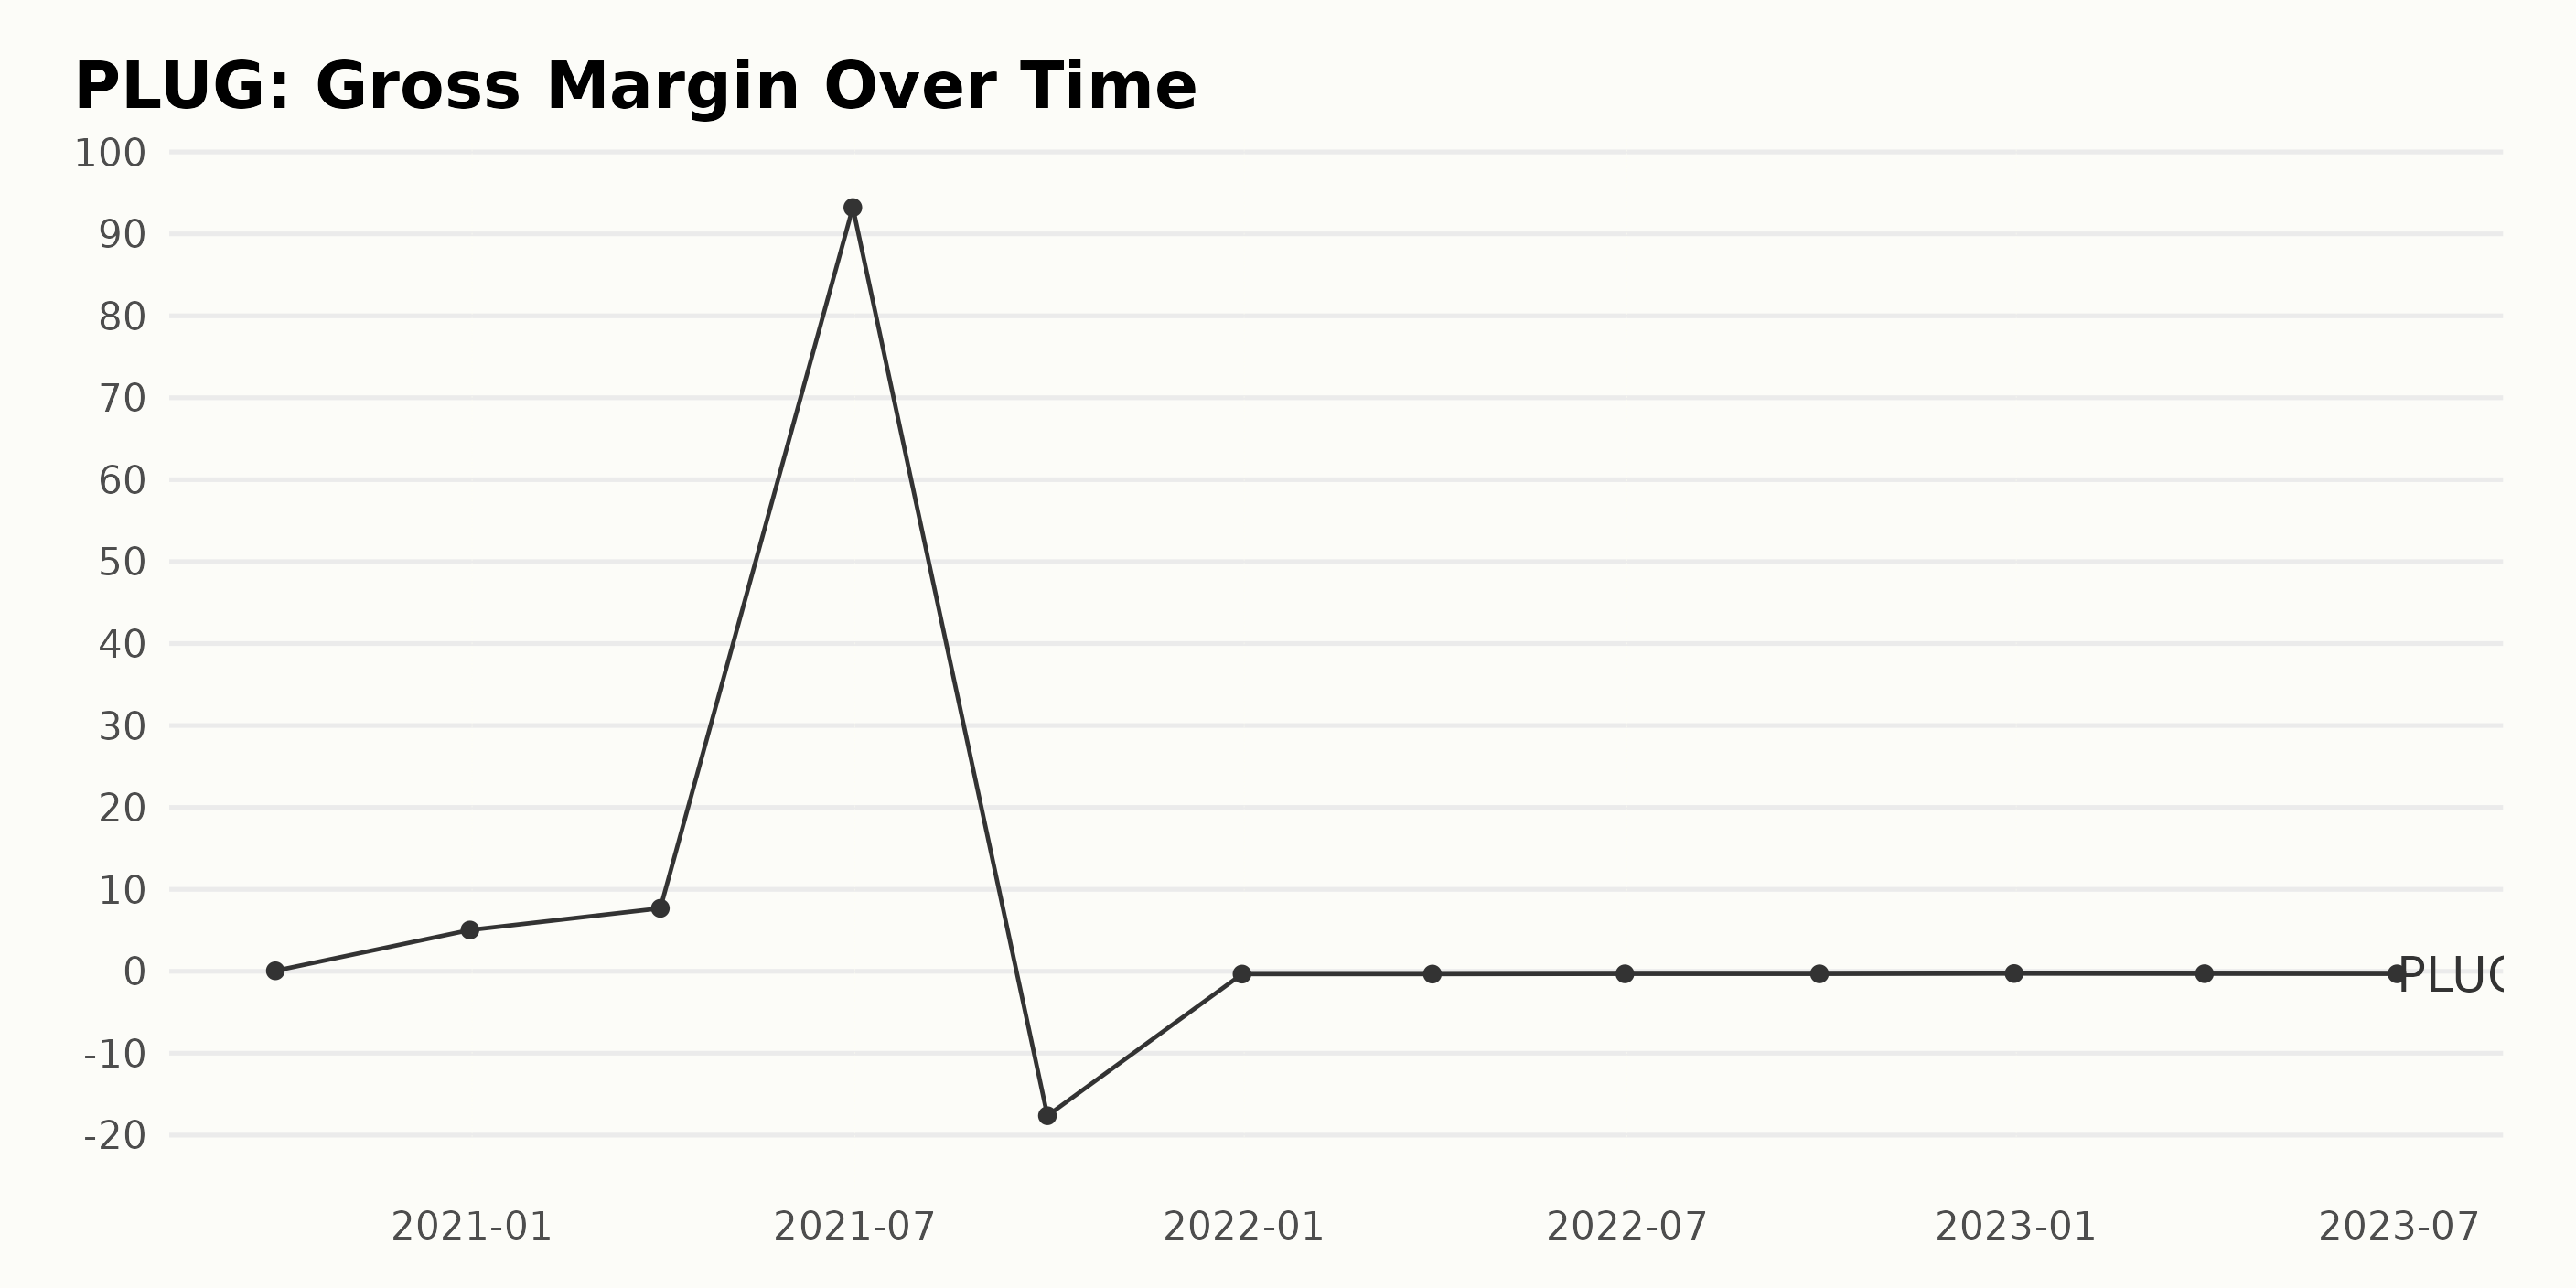
The overall trend of the gross margin for PLUG exhibits significant volatility over the given period from September 2020 to June 2023. Below is a summary of the key points:
- In September 2020, PLUG reported a gross margin of 5.9%
- By December 2020, there was a major surge in the gross margin, reaching 503.5% representing substantial growth.
- This uptrend continues into the first quarter of 2021, where the gross margin peaks at 768.4% in March 2021.
- However, in June 2021, there was a significant spike in the gross margin, escalating to an impressive 9321.9%.
- The trend then took a drastic downturn in September 2021 with a negative gross margin of -1762.9%. This negative trend persists throughout the rest of the time series.
- At the end of 2021, the gross margin drops to -34.1%, marking a recovery from the previous negative value.
- Throughout 2022 and into mid-2023, PLUG’s gross margin stability slightly improves, fluctuating around the range of -30%.
- As of June 2023, the latest value in the series, the gross margin stands at -31.2%.
The calculated growth rate, measuring the last value from the first, indicates a substantial decrease, from 5.9% to -31.2%. This reflects a significant reduction in the gross margin, throwing light on the financial struggles the company seems to have experienced in recent years. The most recent data suggest a persistent negative trend, though the fluctuations appear less severe than prior periods.
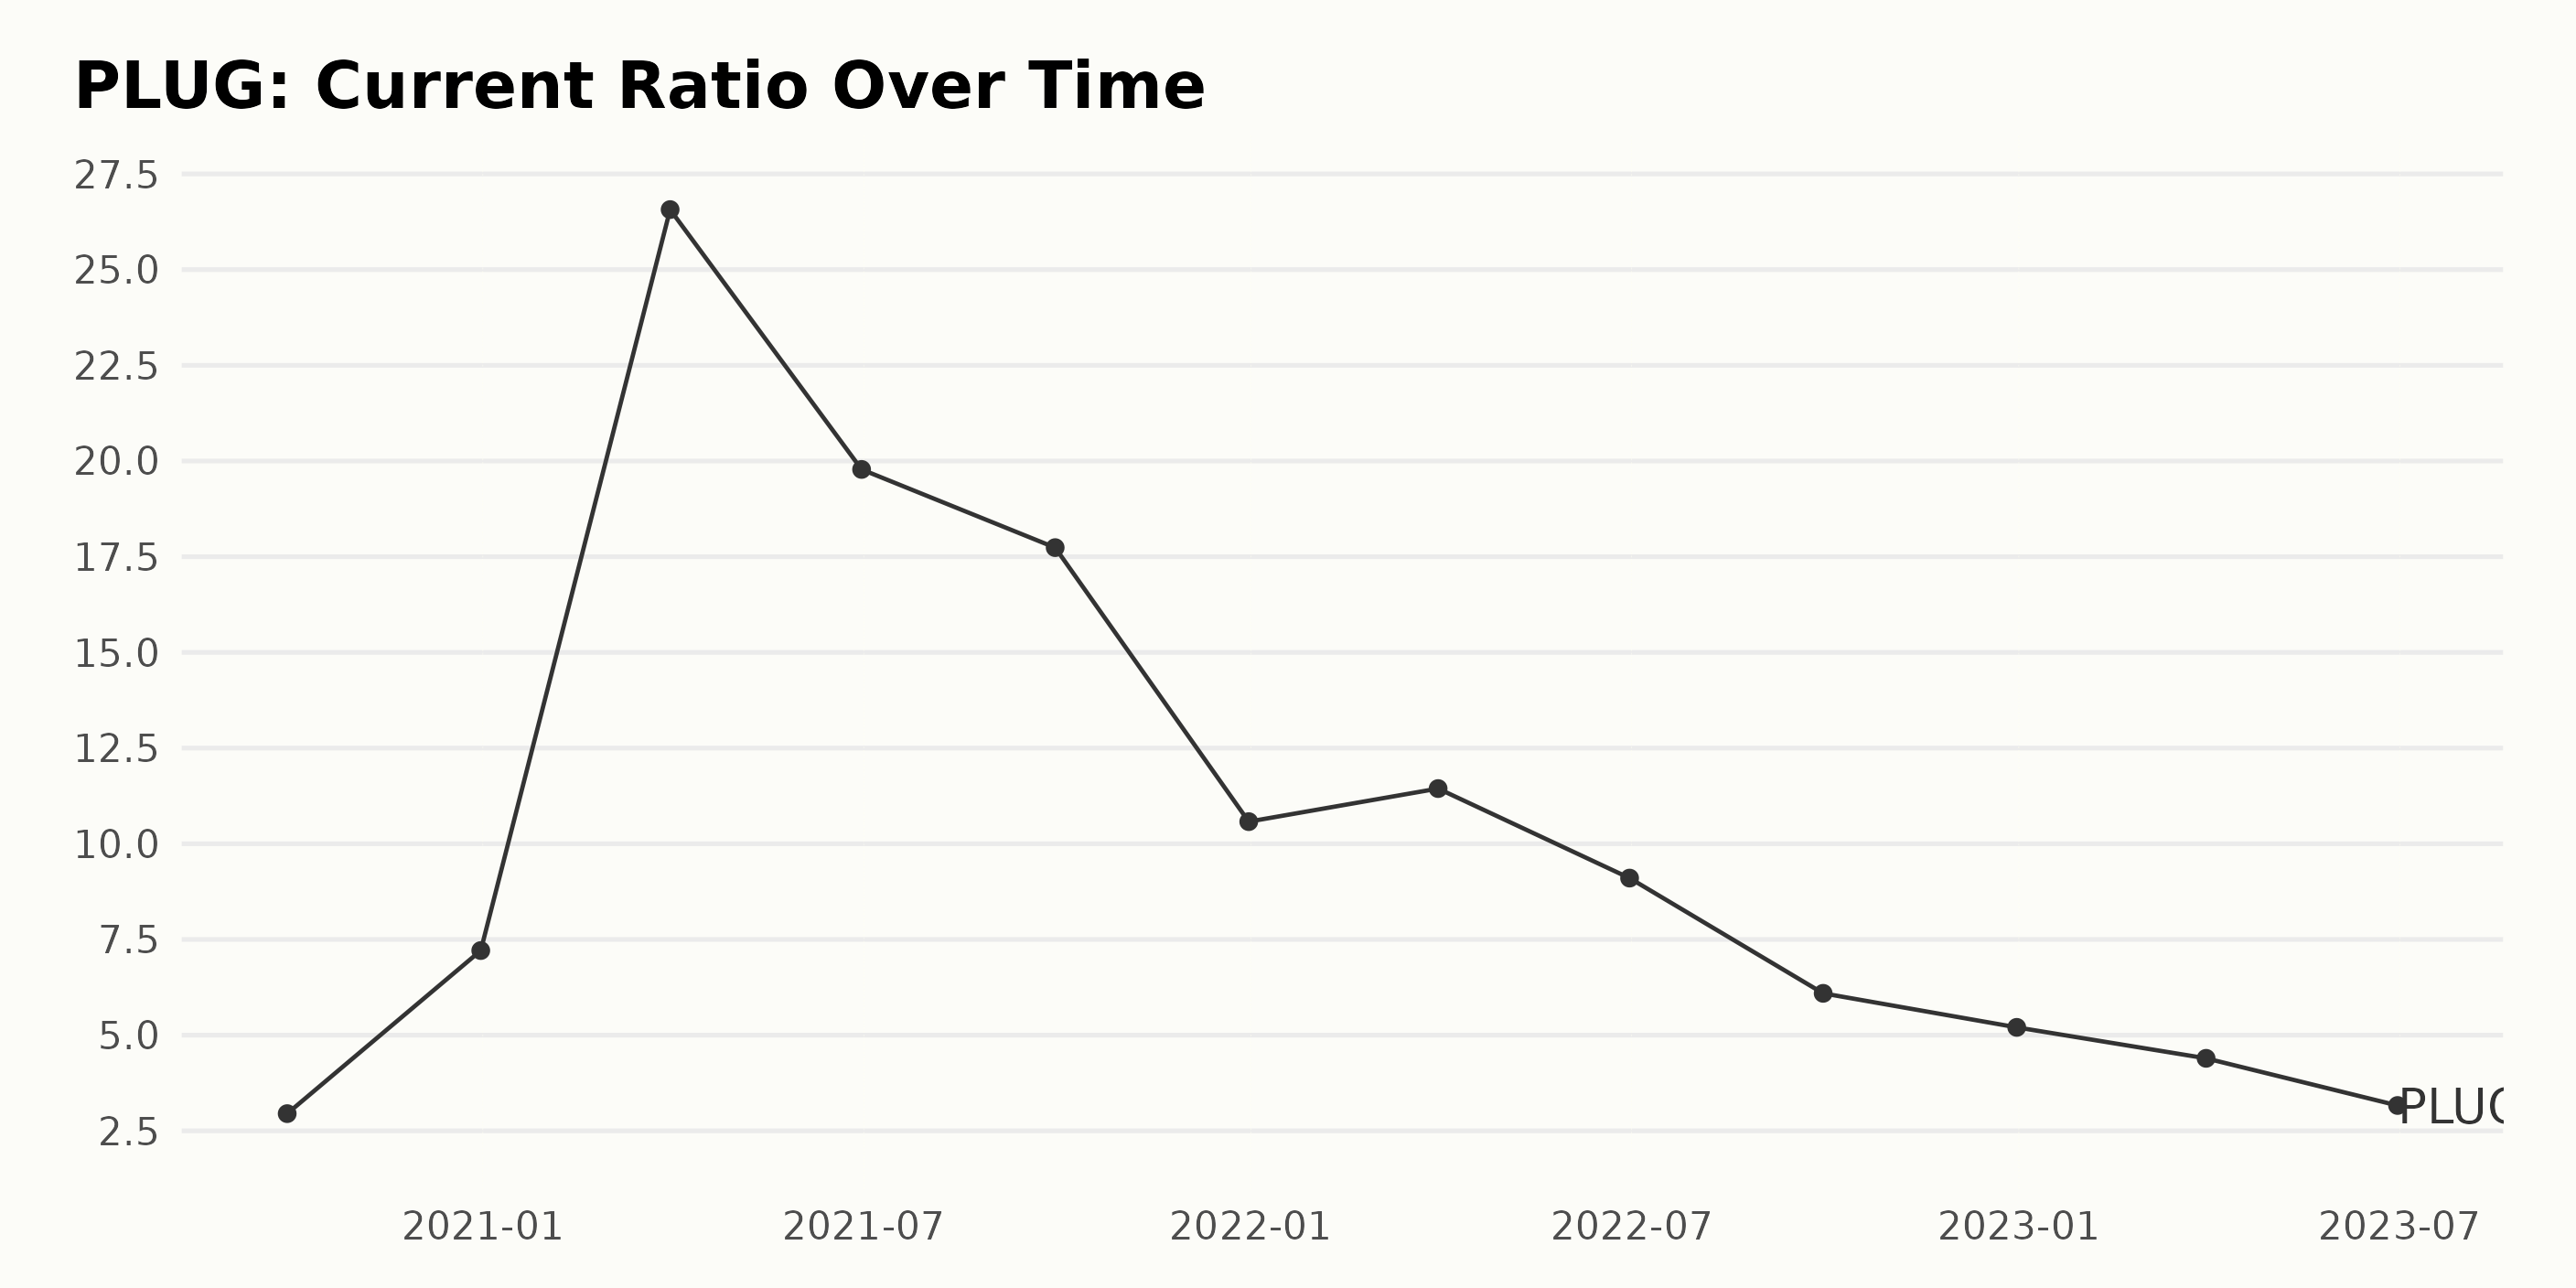
The series of data presents the Current Ratio trend for PLUG.
- Starting in September 2020 with a Current Ratio of 2.95, there was a significant rise by December 2020, reaching a value of 7.21.
- The ratio then experienced an extraordinary increase to peak at an all-time high of 26.57 in March 2021.
- Subsequently, there was a drop observed in June 2021 to a Current Ratio of 19.78, followed by a slight decrease to 17.74 by September 2021.
- In December 2021, the Current Ratio dramatically dipped to 10.58, beginning a more consistent downward trend.
- The dropping trend persisted across 2022 and into 2023, with a brief plateau in the first quarter of 2022, holding at 11.44. From that point, the Current Ratio steadily declined, falling to 9.10 in June 2022 and further declining to 6.09 by September 2022.
- By the end of 2022, the Current Ratio was recorded at 5.20. It continued falling through the first half of 2023, down to 3.16 at the end of June 2023.
As of late, the most recent data displays a consistent downward trend in the Current Ratio of PLUG. From its peak in March 2021, the Current Ratio has since fallen by around 88%, marking a decline in the company’s liquidity position. Comparing the last value (3.16 in June 2023) to the first in the series (2.95 in September 2020), the growth rate of the Current Ratio is approximately 7.1%. Conclusively, PLUG’s Current Ratio emerged from an upward-jagged fluctuation over 2020 and 2021. It then transitioned into a more regular declining trend throughout 2022 and the first half of 2023.
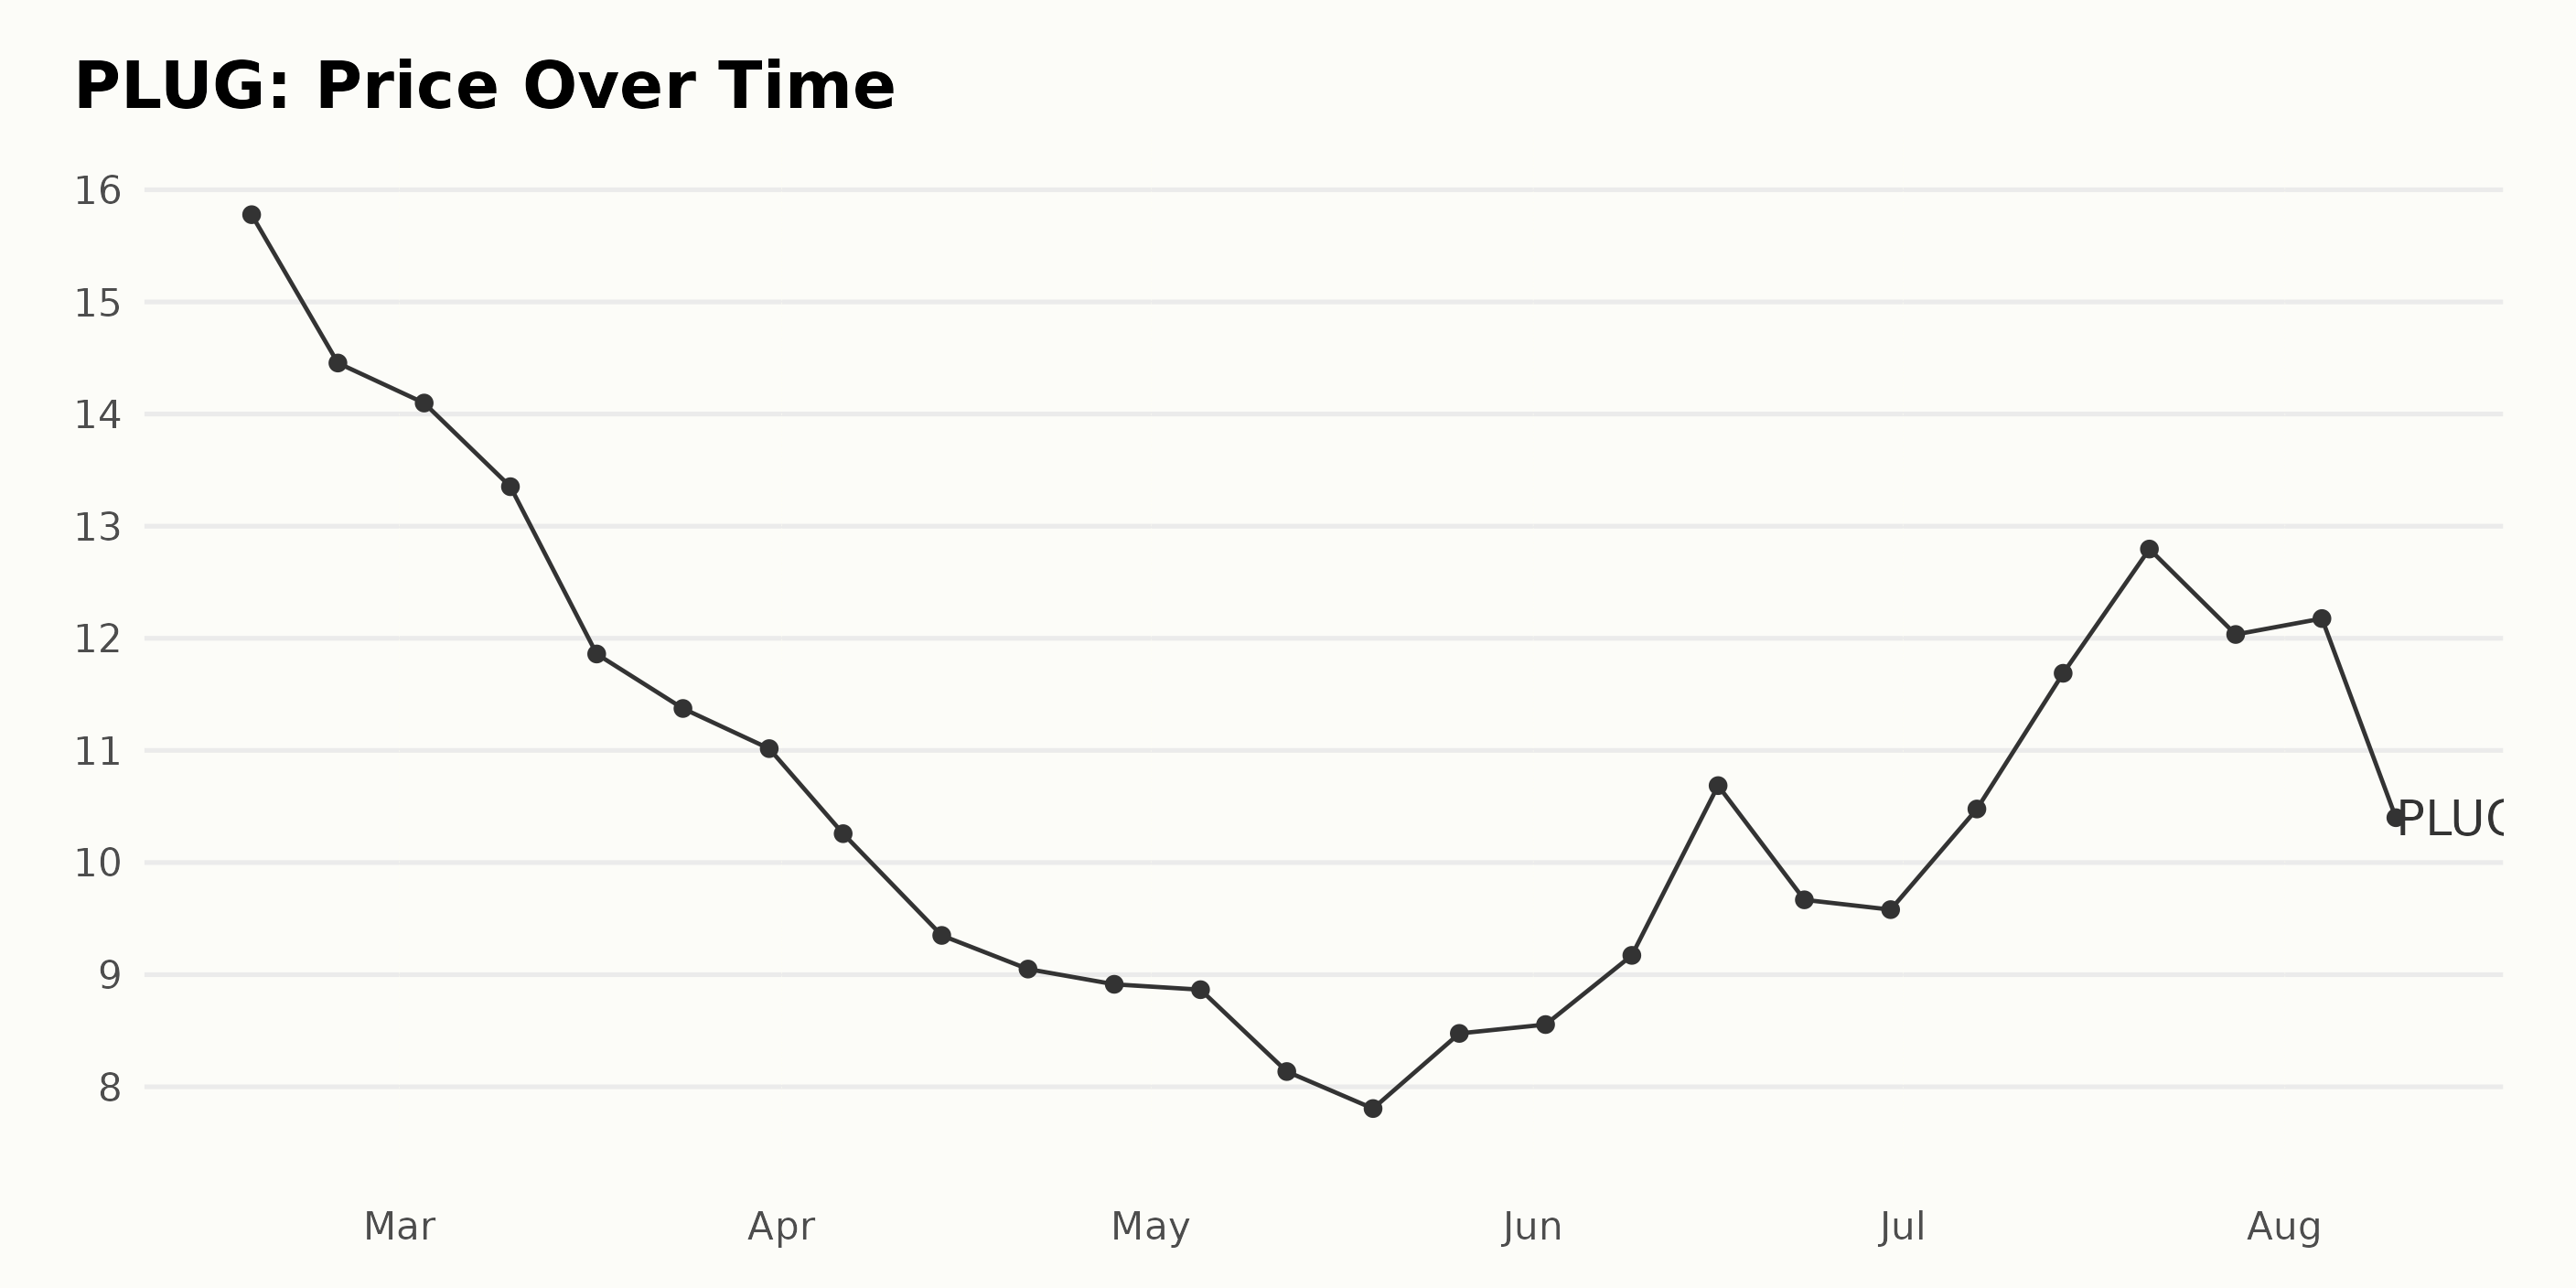
Analyzing PLUG’s Fluctuating Share Price from February to August 2023
The data on PLUG’s share prices from February to August 2023 shows a fluctuating trend with periods of both increases and decreases. Specifically:
- From February 17, 2023, to March 31, 2023, there is a significant downward trend, with the share price decreasing from $15.78 to $11.02. This indicates a deceleration.
- Throughout April 2023, the downward trend continued but at a slower pace, bottoming out at $8.91 by the end of the month.
- In May 2023, the trend initially continued downwards, reaching its lowest point of $7.81 on May 19, 2023, before bouncing back up to $8.48 by the end of the month.
- Then, from June 2023 to mid-July 2023, there was a considerable upward trend, with the share price escalating from $8.56 to its peak of $12.80 on July 21, 2023. This represents an acceleration.
- The price underwent slight fluctuations from July 21, 2023, until August 4, 2023, but remained around the $12 mark.
- As of the last data point on August 10, 2023, a substantial drop to $9.05 indicates a current decelerating trend.
The overall trend from February to August 2023 thus reflects a volatile market for PLUG shares, with notable peaks and troughs. Here is a chart of PLUG’s price over the past 180 days.
Analysis of POWR Ratings Dimensions: Growth, Momentum, and Value for PLUG
PLUG has an overall F rating, translating to a Strong Sell in our POWR Ratings system. It is ranked #91 out of the 92 stocks in the Industrial - Equipment category.
A lower rank in category value denotes a better position; however, PLUG mainly stayed in the high 80s throughout this period. Here’s the breakdown of PLUG’s POWR grade and its rank in the category for some key weeks:
- February 18, 2023: POWR grade - F, Rank in category - 86
- March 11, 2023: POWR grade - F, Rank in category - 84
- April 22, 2023: POWR grade - F, Rank in category - 83
- June 3, 2023: POWR grade - F, Rank in category - 84
- July 15, 2023: POWR grade - F, Rank in category - 88
- August 9, 2023: POWR grade - F, Rank in category - 91
As of the most recent data on August 9, 2023, PLUG’s POWR grade is F, with a rank of 91 in the category, indicating that it is not performing well compared to other stocks in the Industrial - Equipment category.
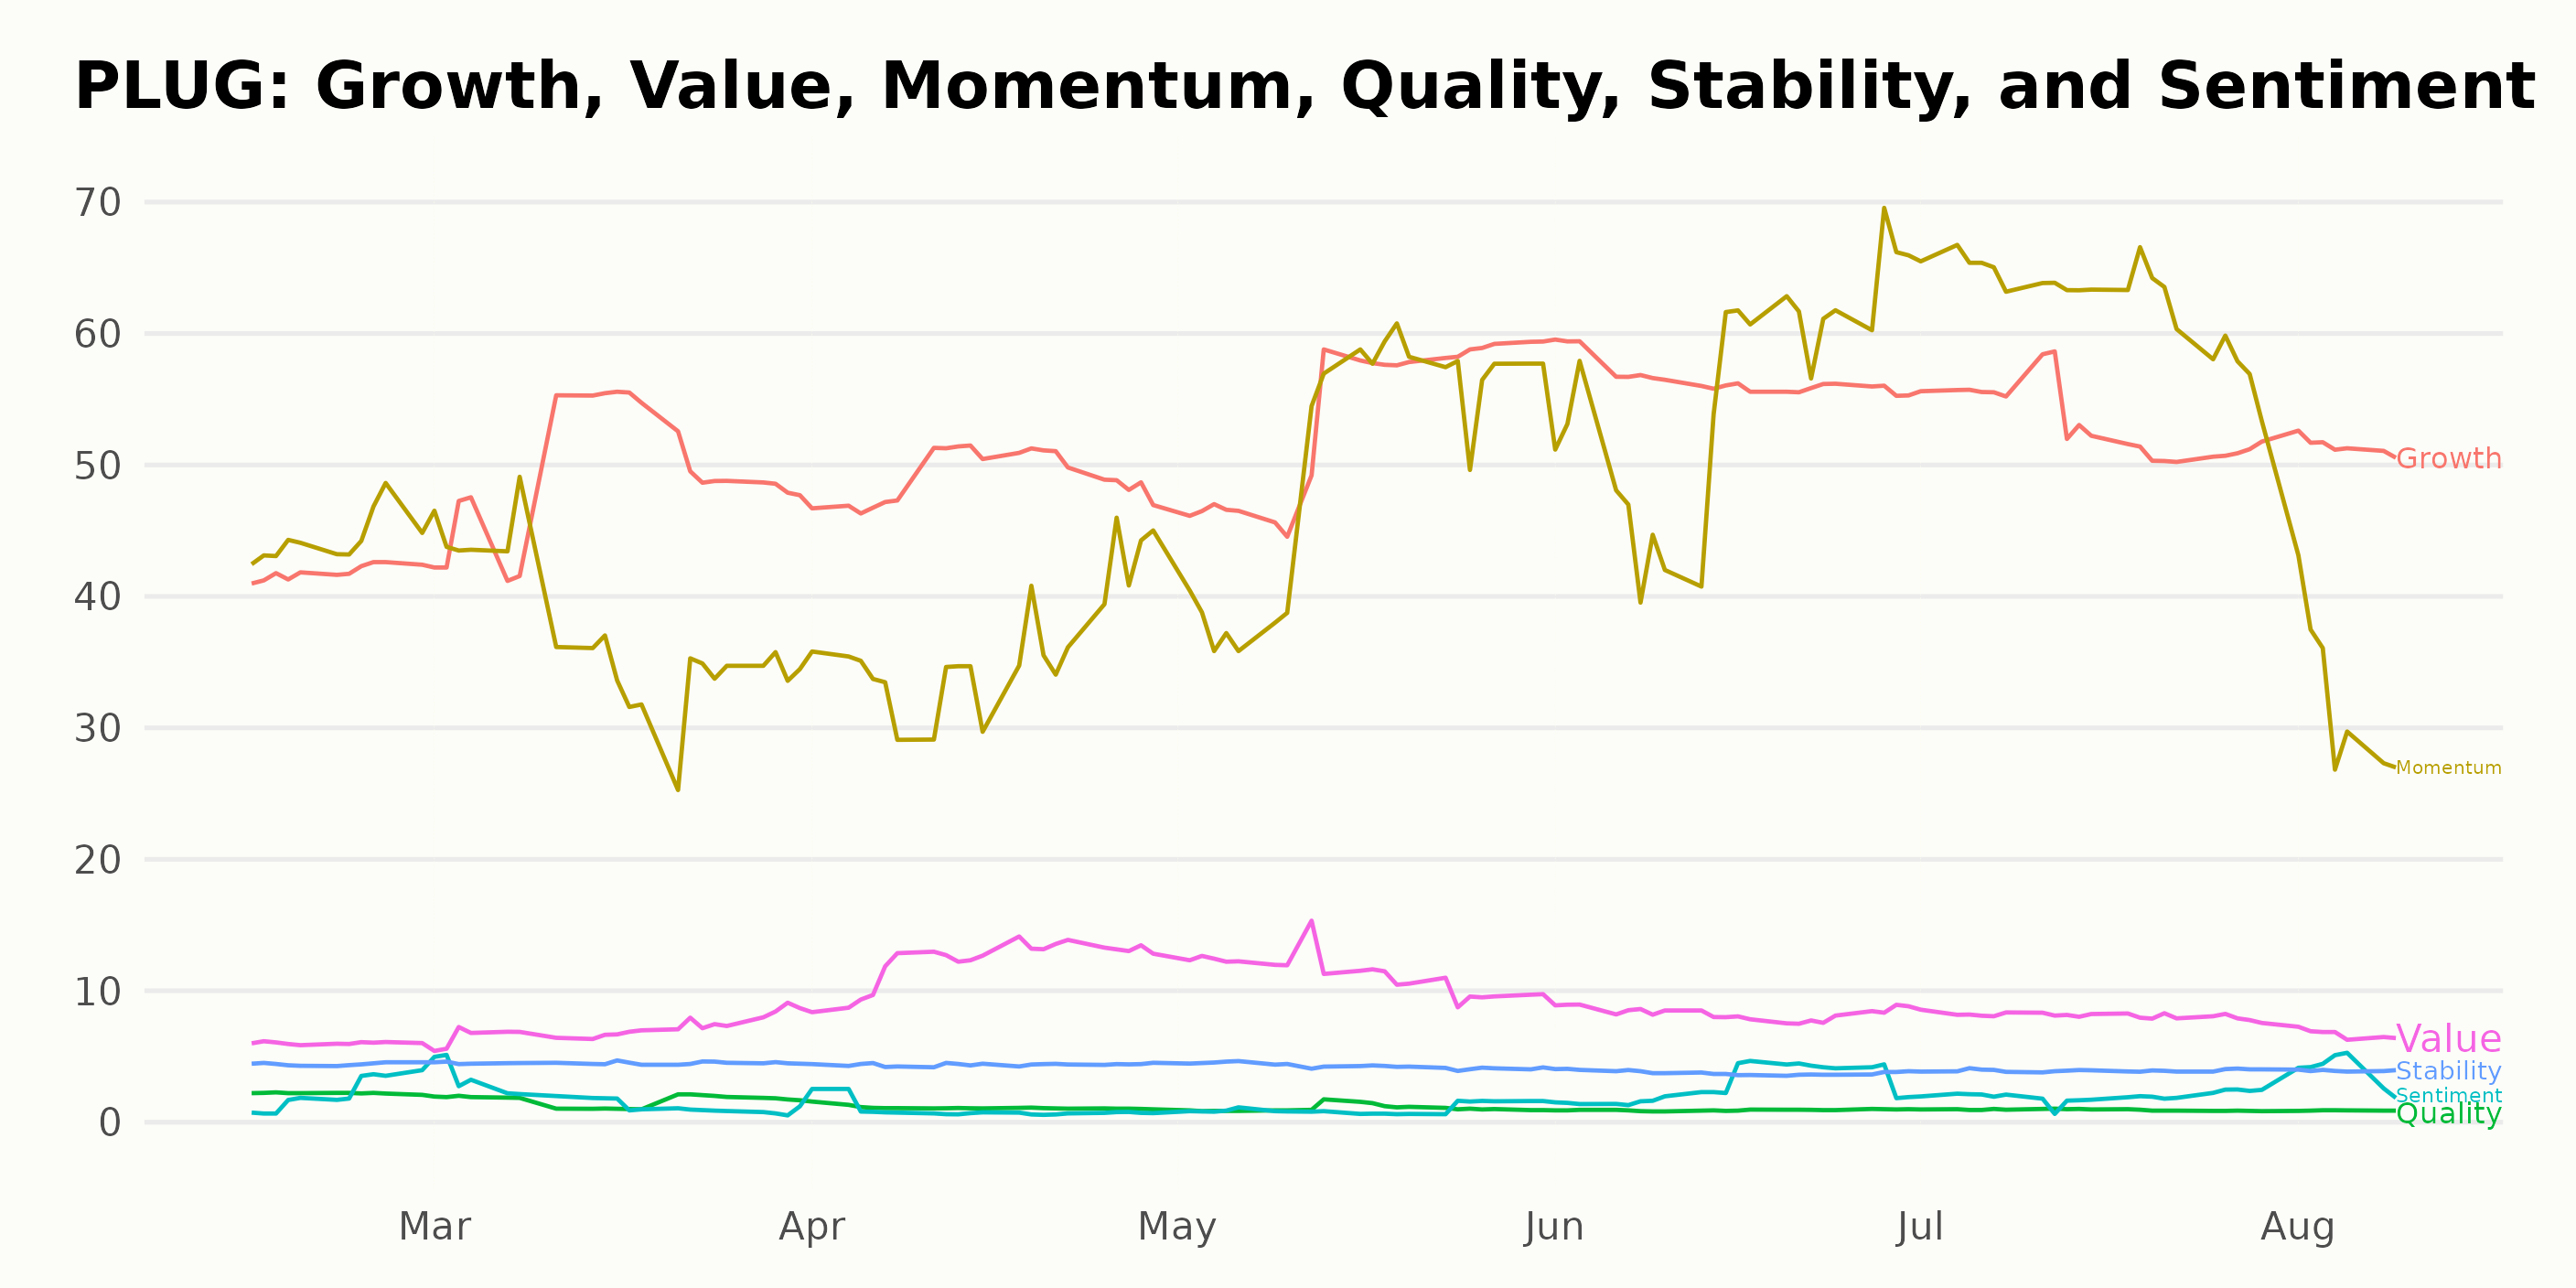
The three most noteworthy dimensions of the POWR Ratings for PLUG include Growth, Momentum, and Value. Over time, these three factors have shown clear trends and high ratings.
- Growth: This dimension showed an upward trend from February to June 2023. It rose from 42 in February 2023 to 57 by June 2023. Post-June, there was a slight decrease, with the rating falling to 51 by August 2023.
- Momentum: The Momentum score has been quite volatile over this period. From 44 in February to 37 in March, it recovered and peaked at 63 in July 2023. However, by August, the momentum significantly dropped to 33.
- Value: This dimension saw a low rating of 6 in February but gradually increased to 12 in April. But after April, the Value rating declined and largely fluctuated around a score of above 7 for the rest of the months until August 2023.
Stocks to Consider Instead of Plug Power Inc. (PLUG)
Other stocks in the Industrial - Equipment sector that may be worth considering are EnerSys (ENS), LSI Industries Inc. (LYTS), and Vontier Corporation (VNT) -- they have better POWR Ratings.
What To Do Next?
Discover 10 widely held stocks that our proprietary model shows have tremendous downside potential. Please make sure none of these “death trap” stocks are lurking in your portfolio:
PLUG shares were trading at $9.03 per share on Friday morning, down $0.02 (-0.22%). Year-to-date, PLUG has declined -27.00%, versus a 17.07% rise in the benchmark S&P 500 index during the same period.
About the Author: Subhasree Kar

Subhasree’s keen interest in financial instruments led her to pursue a career as an investment analyst. After earning a Master’s degree in Economics, she gained knowledge of equity research and portfolio management at Finlatics.
The post Plug Power, Inc. (PLUG): Buy, Hold or Immediate Sell? appeared first on StockNews.com