We maintain several market timing models, each with differing time horizons. The "Ultimate Market Timing Model" is a long-term market timing model based on the research outlined in our post, Building the ultimate market timing model. This model tends to generate only a handful of signals each decade.
The Trend Model is an asset allocation model which applies trend following principles based on the inputs of global stock and commodity price. This model has a shorter time horizon and tends to turn over about 4-6 times a year. In essence, it seeks to answer the question, "Is the trend in the global economy expansion (bullish) or contraction (bearish)?"
My inner trader uses the trading component of the Trend Model to look for changes in the direction of the main Trend Model signal. A bullish Trend Model signal that gets less bullish is a trading "sell" signal. Conversely, a bearish Trend Model signal that gets less bearish is a trading "buy" signal. The history of actual out-of-sample (not backtested) signals of the trading model are shown by the arrows in the chart below. The turnover rate of the trading model is high, and it has varied between 150% to 200% per month.
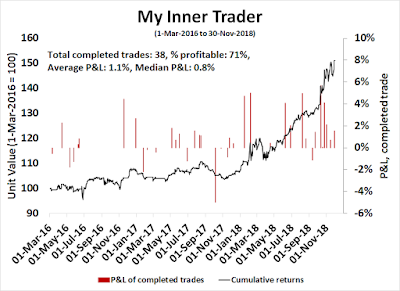
Subscribers receive real-time alerts of model changes, and a hypothetical trading record of the those email alerts are updated weekly here. The hypothetical trading record of the trading model of the real-time alerts that began in March 2016 is shown below.

The latest signals of each model are as follows:
- Ultimate market timing model: Buy equities*
- Trend Model signal: Bearish*
- Trading model: Bullish*
Update schedule: I generally update model readings on my site on weekends and tweet mid-week observations at @humblestudent. Subscribers receive real-time alerts of trading model changes, and a hypothetical trading record of the those email alerts is shown here.
Winter is coming
The market will undoubtedly react positively to the news from Buenos Aires at the market open on Monday. Both sides agreed to a 90-day ceasefire, where the US agreed not to hold off on additional tariffs scheduled for January 1, and China agreed "to purchase a not yet agreed upon, but very substantial, amount of agricultural, energy, industrial, and other product from the United States to reduce the trade imbalance between our two countries". The trade war will be back on if both sides don't come to an agreement after 90 days.
Risk on!
Josh Brown had a terrific analogy for the stock market, though he could not claim to be the originator. He characterized the stock market as a untrained and hyperactive Jack Russell terrier leashed to its owner, the economy. Both move in the same general direction, but the dog`s movements are far more erratic and excitable. They don`t have the same temperament and tendencies, but over time, they move in the same direction.
Technical analysis can help with discerning the short-term movements of the dog, and fundamental and macroeconomic analysis gives us insights on the dog handler. Notwithstanding the results of the trade negotiations in Buenos Aires, our analysis of the handler (economy) provides ample evidence that winter is coming.

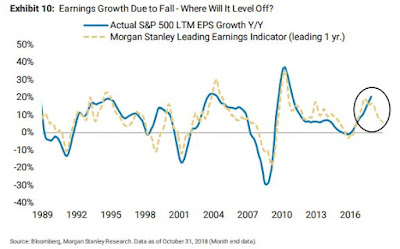
More ominous is the Morgan Stanley Leading Economic Indicator, which is pointing to a significant deceleration in earnings growth in 2019, even without a trade war.

The only question is whether it will be a mild or harsh winter.
The full post can be found at our new site here.
