
Climate control solutions innovator Lennox International (NYSE: LII) missed Wall Street’s revenue expectations in Q4 CY2025, with sales falling 11.2% year on year to $1.20 billion. Its non-GAAP profit of $4.45 per share was 5.7% below analysts’ consensus estimates.
Is now the time to buy Lennox? Find out by accessing our full research report, it’s free.
Lennox (LII) Q4 CY2025 Highlights:
- Revenue: $1.20 billion vs analyst estimates of $1.27 billion (11.2% year-on-year decline, 5.7% miss)
- Adjusted EPS: $4.45 vs analyst expectations of $4.72 (5.7% miss)
- Adjusted EBITDA: $237.2 million vs analyst estimates of $249.3 million (19.8% margin, 4.9% miss)
- Adjusted EPS guidance for the upcoming financial year 2026 is $24.25 at the midpoint, missing analyst estimates by 1.1%
- Operating Margin: 16.4%, down from 18.2% in the same quarter last year
- Free Cash Flow Margin: 31.5%, up from 20.2% in the same quarter last year
- Organic Revenue fell 11% year on year (miss)
- Market Capitalization: $17.49 billion
"We are pleased with our performance in 2025 given industry headwinds. For the first time in its history, Lennox delivered annual margins over 20%, a particularly meaningful accomplishment driven by our cost reduction actions and mix benefits," said CEO, Alok Maskara.
Company Overview
Based in Texas and founded over a century ago, Lennox (NYSE: LII) is a climate control solutions company offering heating, ventilation, air conditioning, and refrigeration (HVACR) goods.
Revenue Growth
A company’s long-term sales performance can indicate its overall quality. Any business can have short-term success, but a top-tier one grows for years. Over the last five years, Lennox grew its sales at a mediocre 7.4% compounded annual growth rate. This wasn’t a great result compared to the rest of the industrials sector, but there are still things to like about Lennox.
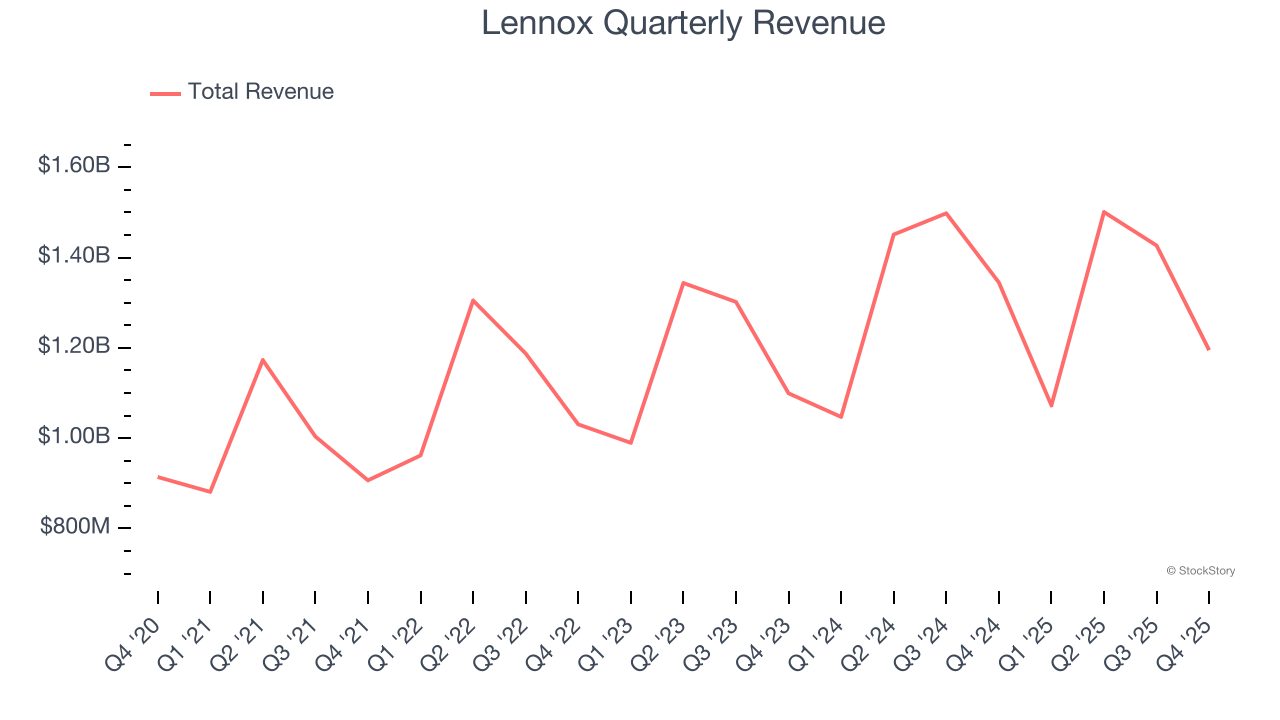
We at StockStory place the most emphasis on long-term growth, but within industrials, a half-decade historical view may miss cycles, industry trends, or a company capitalizing on catalysts such as a new contract win or a successful product line. Lennox’s recent performance shows its demand has slowed as its annualized revenue growth of 4.8% over the last two years was below its five-year trend. 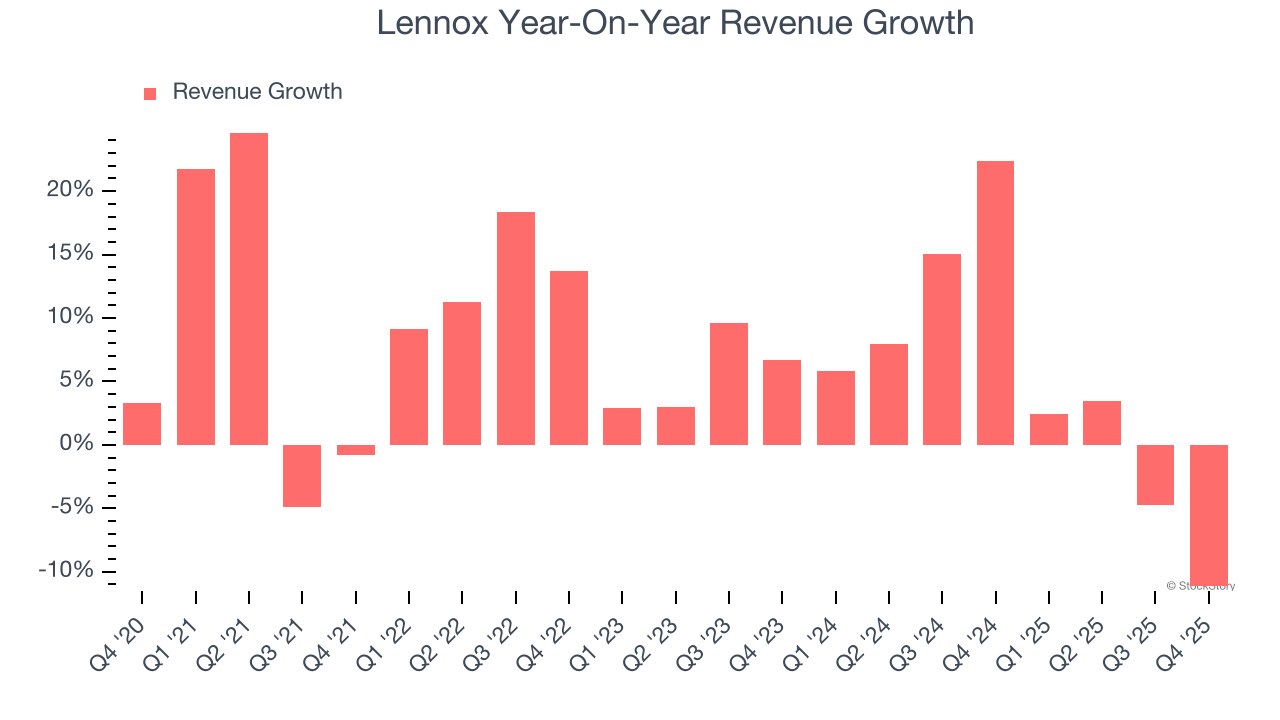
Lennox also reports organic revenue, which strips out one-time events like acquisitions and currency fluctuations that don’t accurately reflect its fundamentals. Over the last two years, Lennox’s organic revenue averaged 4.3% year-on-year growth. Because this number aligns with its two-year revenue growth, we can see the company’s core operations (not acquisitions and divestitures) drove most of its results. 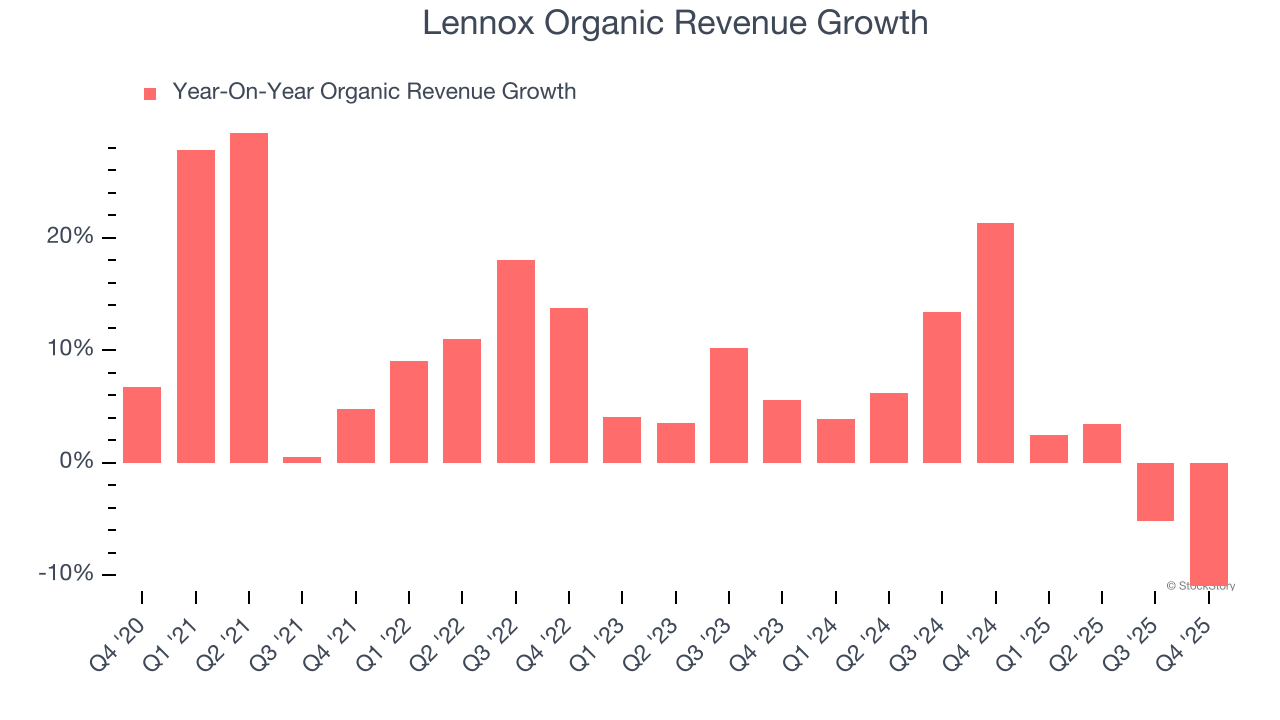
This quarter, Lennox missed Wall Street’s estimates and reported a rather uninspiring 11.2% year-on-year revenue decline, generating $1.20 billion of revenue.
Looking ahead, sell-side analysts expect revenue to grow 8.6% over the next 12 months, an improvement versus the last two years. This projection is above average for the sector and indicates its newer products and services will catalyze better top-line performance.
The 1999 book Gorilla Game predicted Microsoft and Apple would dominate tech before it happened. Its thesis? Identify the platform winners early. Today, enterprise software companies embedding generative AI are becoming the new gorillas. a profitable, fast-growing enterprise software stock that is already riding the automation wave and looking to catch the generative AI next.
Operating Margin
Lennox has been a well-oiled machine over the last five years. It demonstrated elite profitability for an industrials business, boasting an average operating margin of 17.2%. This result was particularly impressive because of its low gross margin, which is mostly a factor of what it sells and takes huge shifts to move meaningfully. Companies have more control over their operating margins, and it’s a show of well-managed operations if they’re high when gross margins are low.
Analyzing the trend in its profitability, Lennox’s operating margin rose by 4.7 percentage points over the last five years, as its sales growth gave it operating leverage.
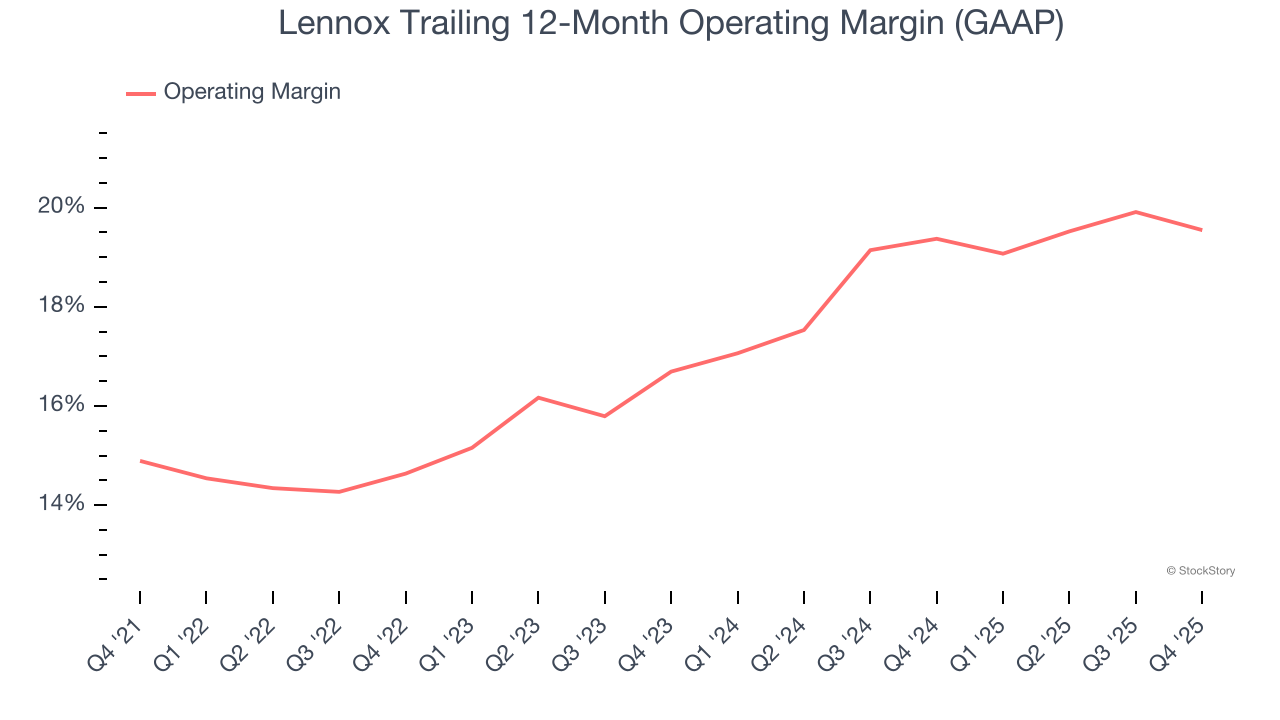
In Q4, Lennox generated an operating margin profit margin of 16.4%, down 1.8 percentage points year on year. Since Lennox’s operating margin decreased more than its gross margin, we can assume it was less efficient because expenses such as marketing, R&D, and administrative overhead increased.
Earnings Per Share
We track the long-term change in earnings per share (EPS) for the same reason as long-term revenue growth. Compared to revenue, however, EPS highlights whether a company’s growth is profitable.
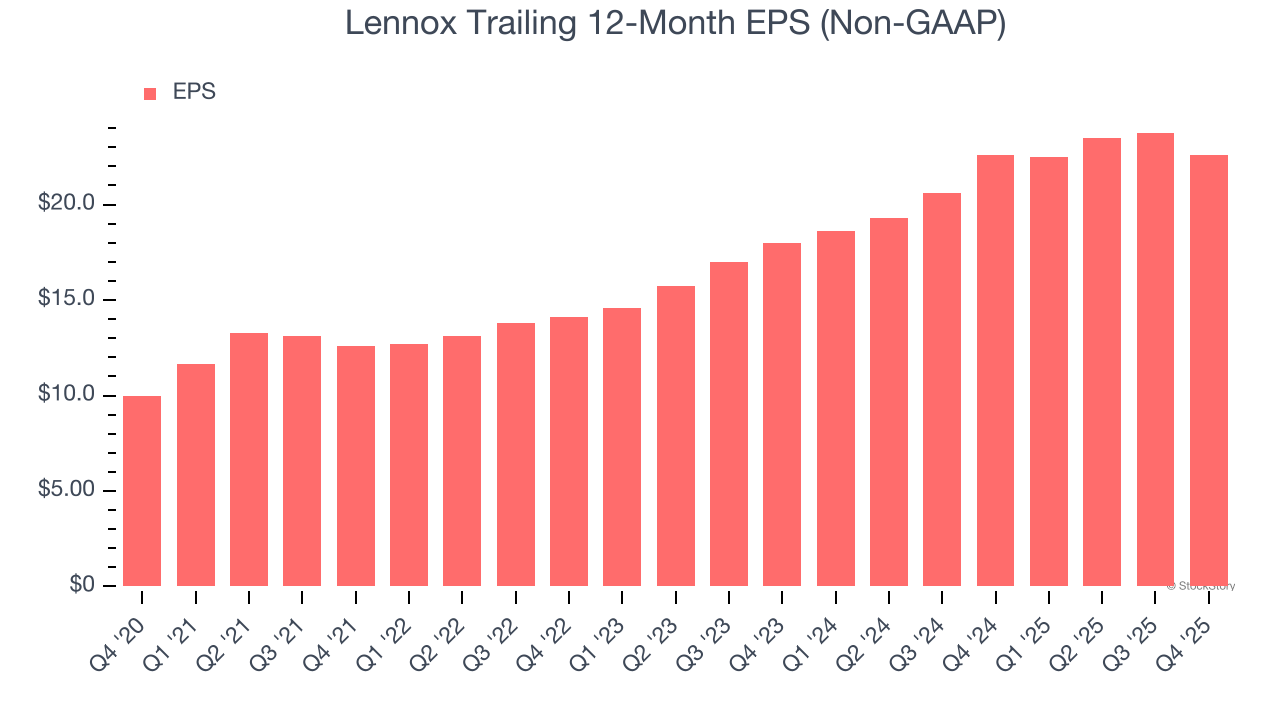
Lennox’s EPS grew at an astounding 17.9% compounded annual growth rate over the last five years, higher than its 7.4% annualized revenue growth. This tells us the company became more profitable on a per-share basis as it expanded.
We can take a deeper look into Lennox’s earnings to better understand the drivers of its performance. As we mentioned earlier, Lennox’s operating margin declined this quarter but expanded by 4.7 percentage points over the last five years. Its share count also shrank by 9.1%, and these factors together are positive signs for shareholders because improving profitability and share buybacks turbocharge EPS growth relative to revenue growth. 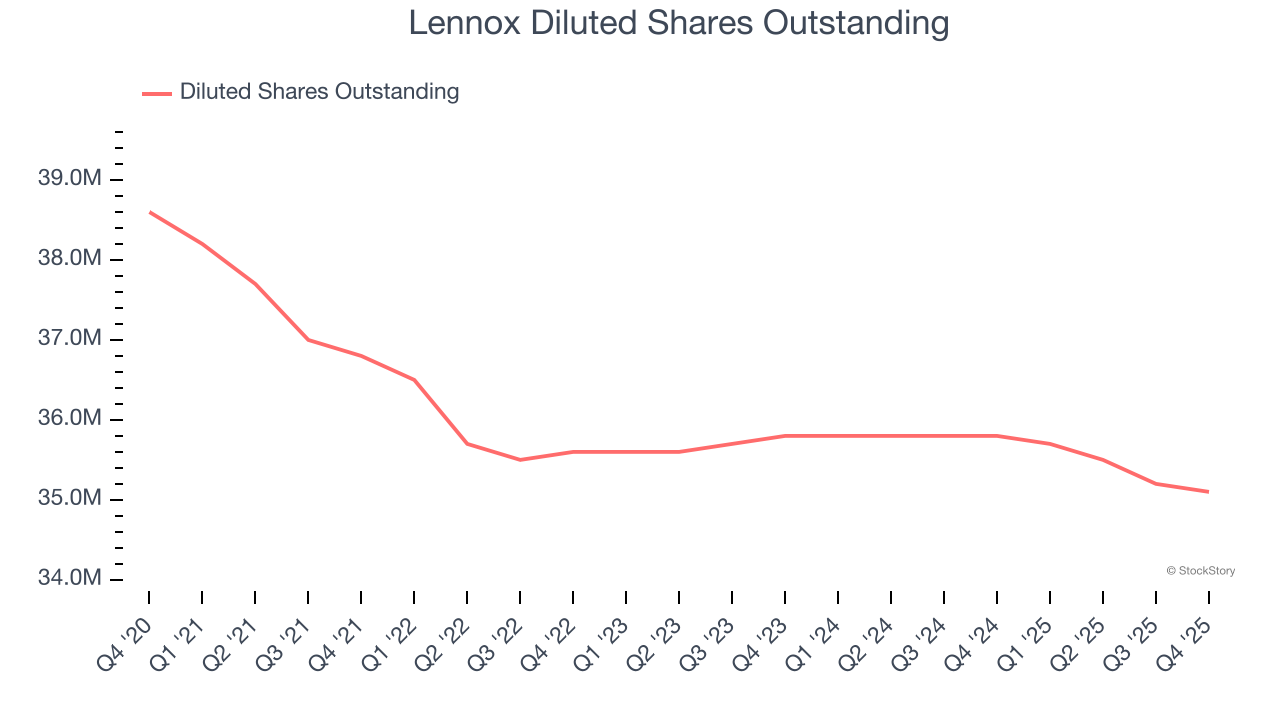
Like with revenue, we analyze EPS over a more recent period because it can provide insight into an emerging theme or development for the business.
For Lennox, its two-year annual EPS growth of 12.2% was lower than its five-year trend. We still think its growth was good and hope it can accelerate in the future.
In Q4, Lennox reported adjusted EPS of $4.45, down from $5.60 in the same quarter last year. This print missed analysts’ estimates, but we care more about long-term adjusted EPS growth than short-term movements. Over the next 12 months, Wall Street expects Lennox’s full-year EPS of $22.62 to grow 7.7%.
Key Takeaways from Lennox’s Q4 Results
We struggled to find many positives in these results. Its revenue missed and its EPS fell short of Wall Street’s estimates. Overall, this was a softer quarter. The stock traded down 3.8% to $480 immediately following the results.
Lennox may have had a tough quarter, but does that actually create an opportunity to invest right now? What happened in the latest quarter matters, but not as much as longer-term business quality and valuation, when deciding whether to invest in this stock. We cover that in our actionable full research report which you can read here (it’s free).


