
The most successful technical traders rarely rely on just one signal. Instead, they look to a few go-to indicators for confirmation before acting on buy and sell signals.
In a recent webinar, John Rowland, Barchart’s Senior Market Strategist, showed traders how to use Bollinger Bands and the Relative Strength Index (RSI) to dramatically improve the accuracy of trend and reversal signals from Heikin Ashi candlesticks.
Why Heikin Ashi Candlesticks Are Different
Heikin Ashi candlesticks are designed to smooth out price “noise,” making trends easier to identify.
Unlike traditional candlesticks, which use actual open-high-low-close values, Heikin Ashi averages these prices to produce a cleaner visual trend. That means fewer fake-outs and more clarity.
“Heikin Ashi is more of a confirmational and delayed signal,” John explains. “So, I like to combine it with other tools to confirm what price is really telling me.”
Bollinger Bands for Breakout & Reversal Confirmation
Bollinger Bands plot volatility by measuring how far prices deviate from a central moving average (typically, the simple 20-day). When bands narrow, it reflects a period of contracting volatility, which can precede an imminent breakout. When bandwidths are wide and prices pierce or close outside the bands, it indicates the kind of momentum extremes that often signal a reversal is imminent.
In John’s example, he identifies a narrowing band, followed by a Heikin Ashi candle turning green — a sign that momentum is shifting.
“When you have narrow Bollinger bands and then price breaks above as the bands turn outward,” he says, “that’s a breakout confirmation.”
When RSI Divergence is a Warning
RSI helps identify when momentum is overbought (too hot) or oversold (too cold). But John takes it one step further by using RSI divergence to help confirm trend reversals.
When “price is going higher,” as John explains, “but RSI isn’t going higher — that’s a negative divergence and a warning that momentum may be changing.”
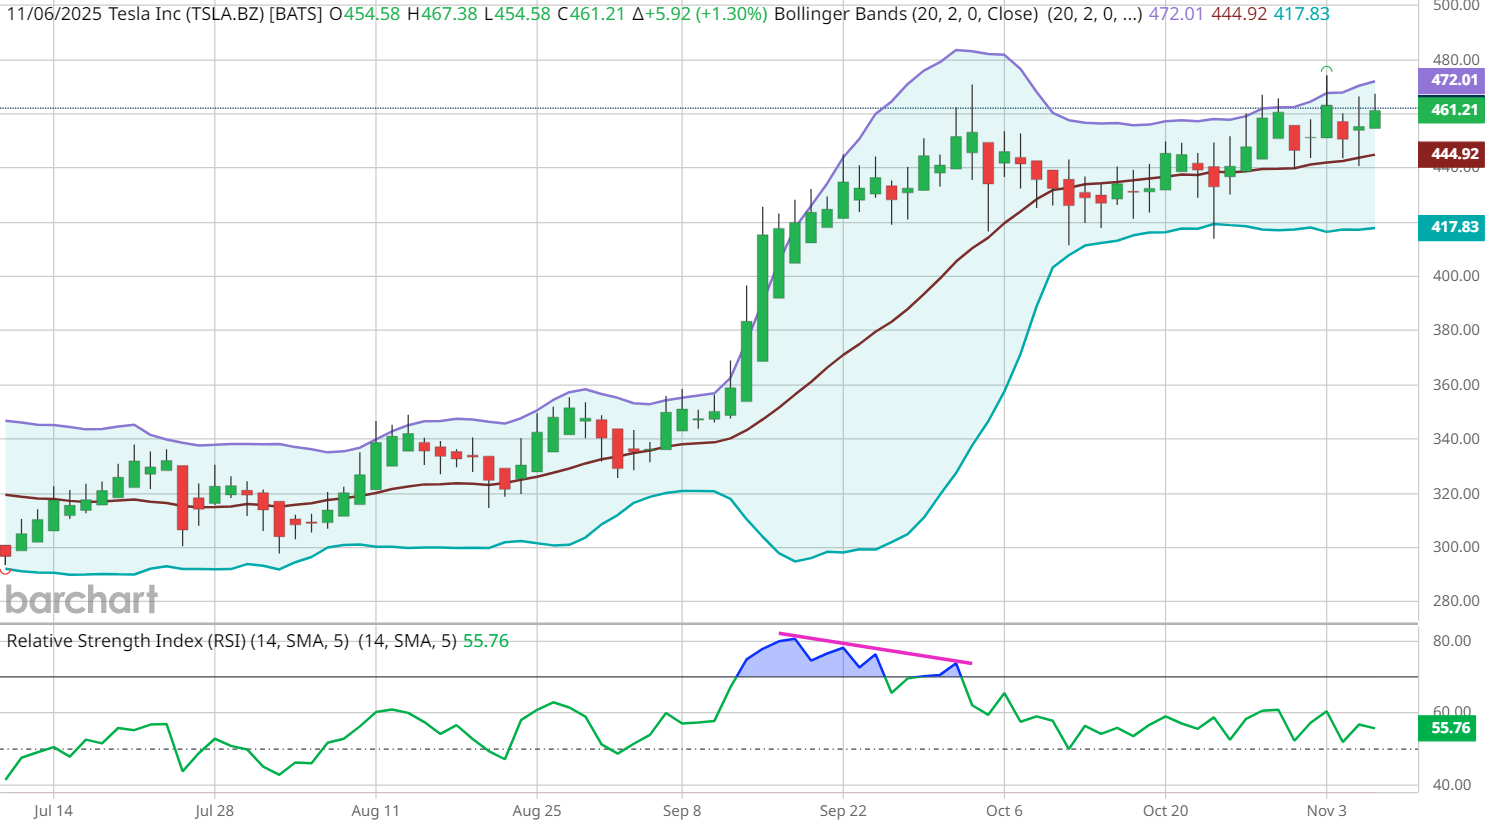
This type of RSI divergence, especially when accompanied by Heikin Ashi candles that are smaller and have lower wicks, can be an early indication that a trend reversal is approaching.
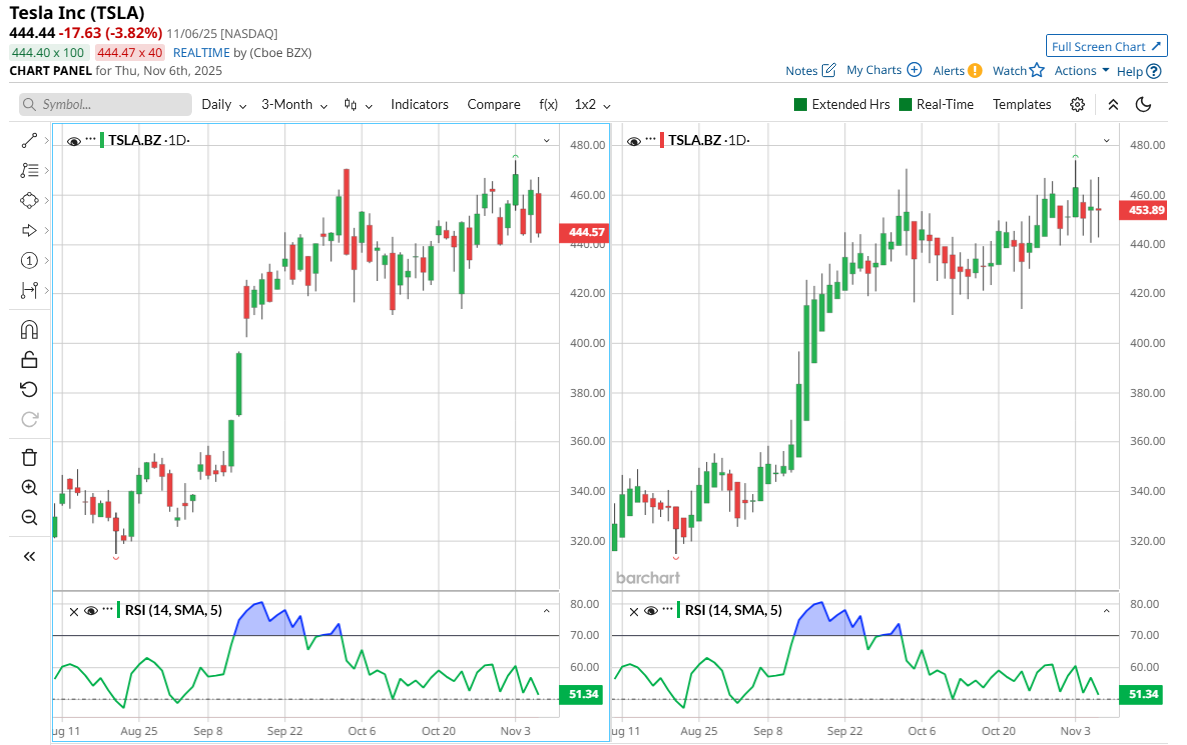
In John’s Tesla (TSLA) example, Heikin Ashi confirms what RSI suggests: the bulls are losing steam, and sellers are taking control.
The Full Confirmation Checklist
Here’s John’s signal-stacking approach in action:
- Heikin Ashi smooths noise and identifies trend direction.
- Bollinger Bands highlight breakout or reversal zones.
- RSI confirms the underlying strength of the move.
Using this trifecta together can help traders filter out false signals and find both long and short entry points with higher conviction.
Barchart Tools to Master This Strategy
To dial in on cleaner technical signals in your own trading, try these Barchart tools:
- Technical Analysis Page — track RSI, Average True Range, and moving averages for any stock.
- Breakouts & Reversals Screener — instantly find stocks showing fresh breakouts or reversals.
- New Recommendations — see which stocks are triggering Bollinger Band signals.
Final Takeaway
No single indicator tells the whole story. But taken together, the combination of Heikin Ashi, Bollinger Bands, and RSI can paint a powerful picture.
“This is how you confirm what you already believe about price action,” John says. “It’s not prediction — it’s validation.”
Whether you’re swing trading or investing longer-term, this strategy helps cut through the noise and make smarter, data-backed decisions.
Watch the Clip: Confirming Heikin Ashi Signals with RSI and Bollinger Bands →
- Watch the Full Webinar: How to Trade Heikin Ashi Candlesticks
- Customize Barchart’s Chart Templates with Bollinger Bands and RSI
On the date of publication, Barchart Insights did not have (either directly or indirectly) positions in any of the securities mentioned in this article. All information and data in this article is solely for informational purposes. For more information please view the Barchart Disclosure Policy here.
More news from Barchart
- Analysts Expect Growth at Amazon to ‘Accelerate.’ Does That Make AMZN Stock a Buy Now?
- Google Cloud Could Grow More Than 50% in 2026. Should You Buy GOOGL Stock Here?
- Apple’s Record Quarter Hints at Something Huge Coming: Is AAPL Stock a Buy Now?
- 2 Chart Indicators to Confirm Stock Breakouts & Reversals with Heikin Ashi Candlesticks


